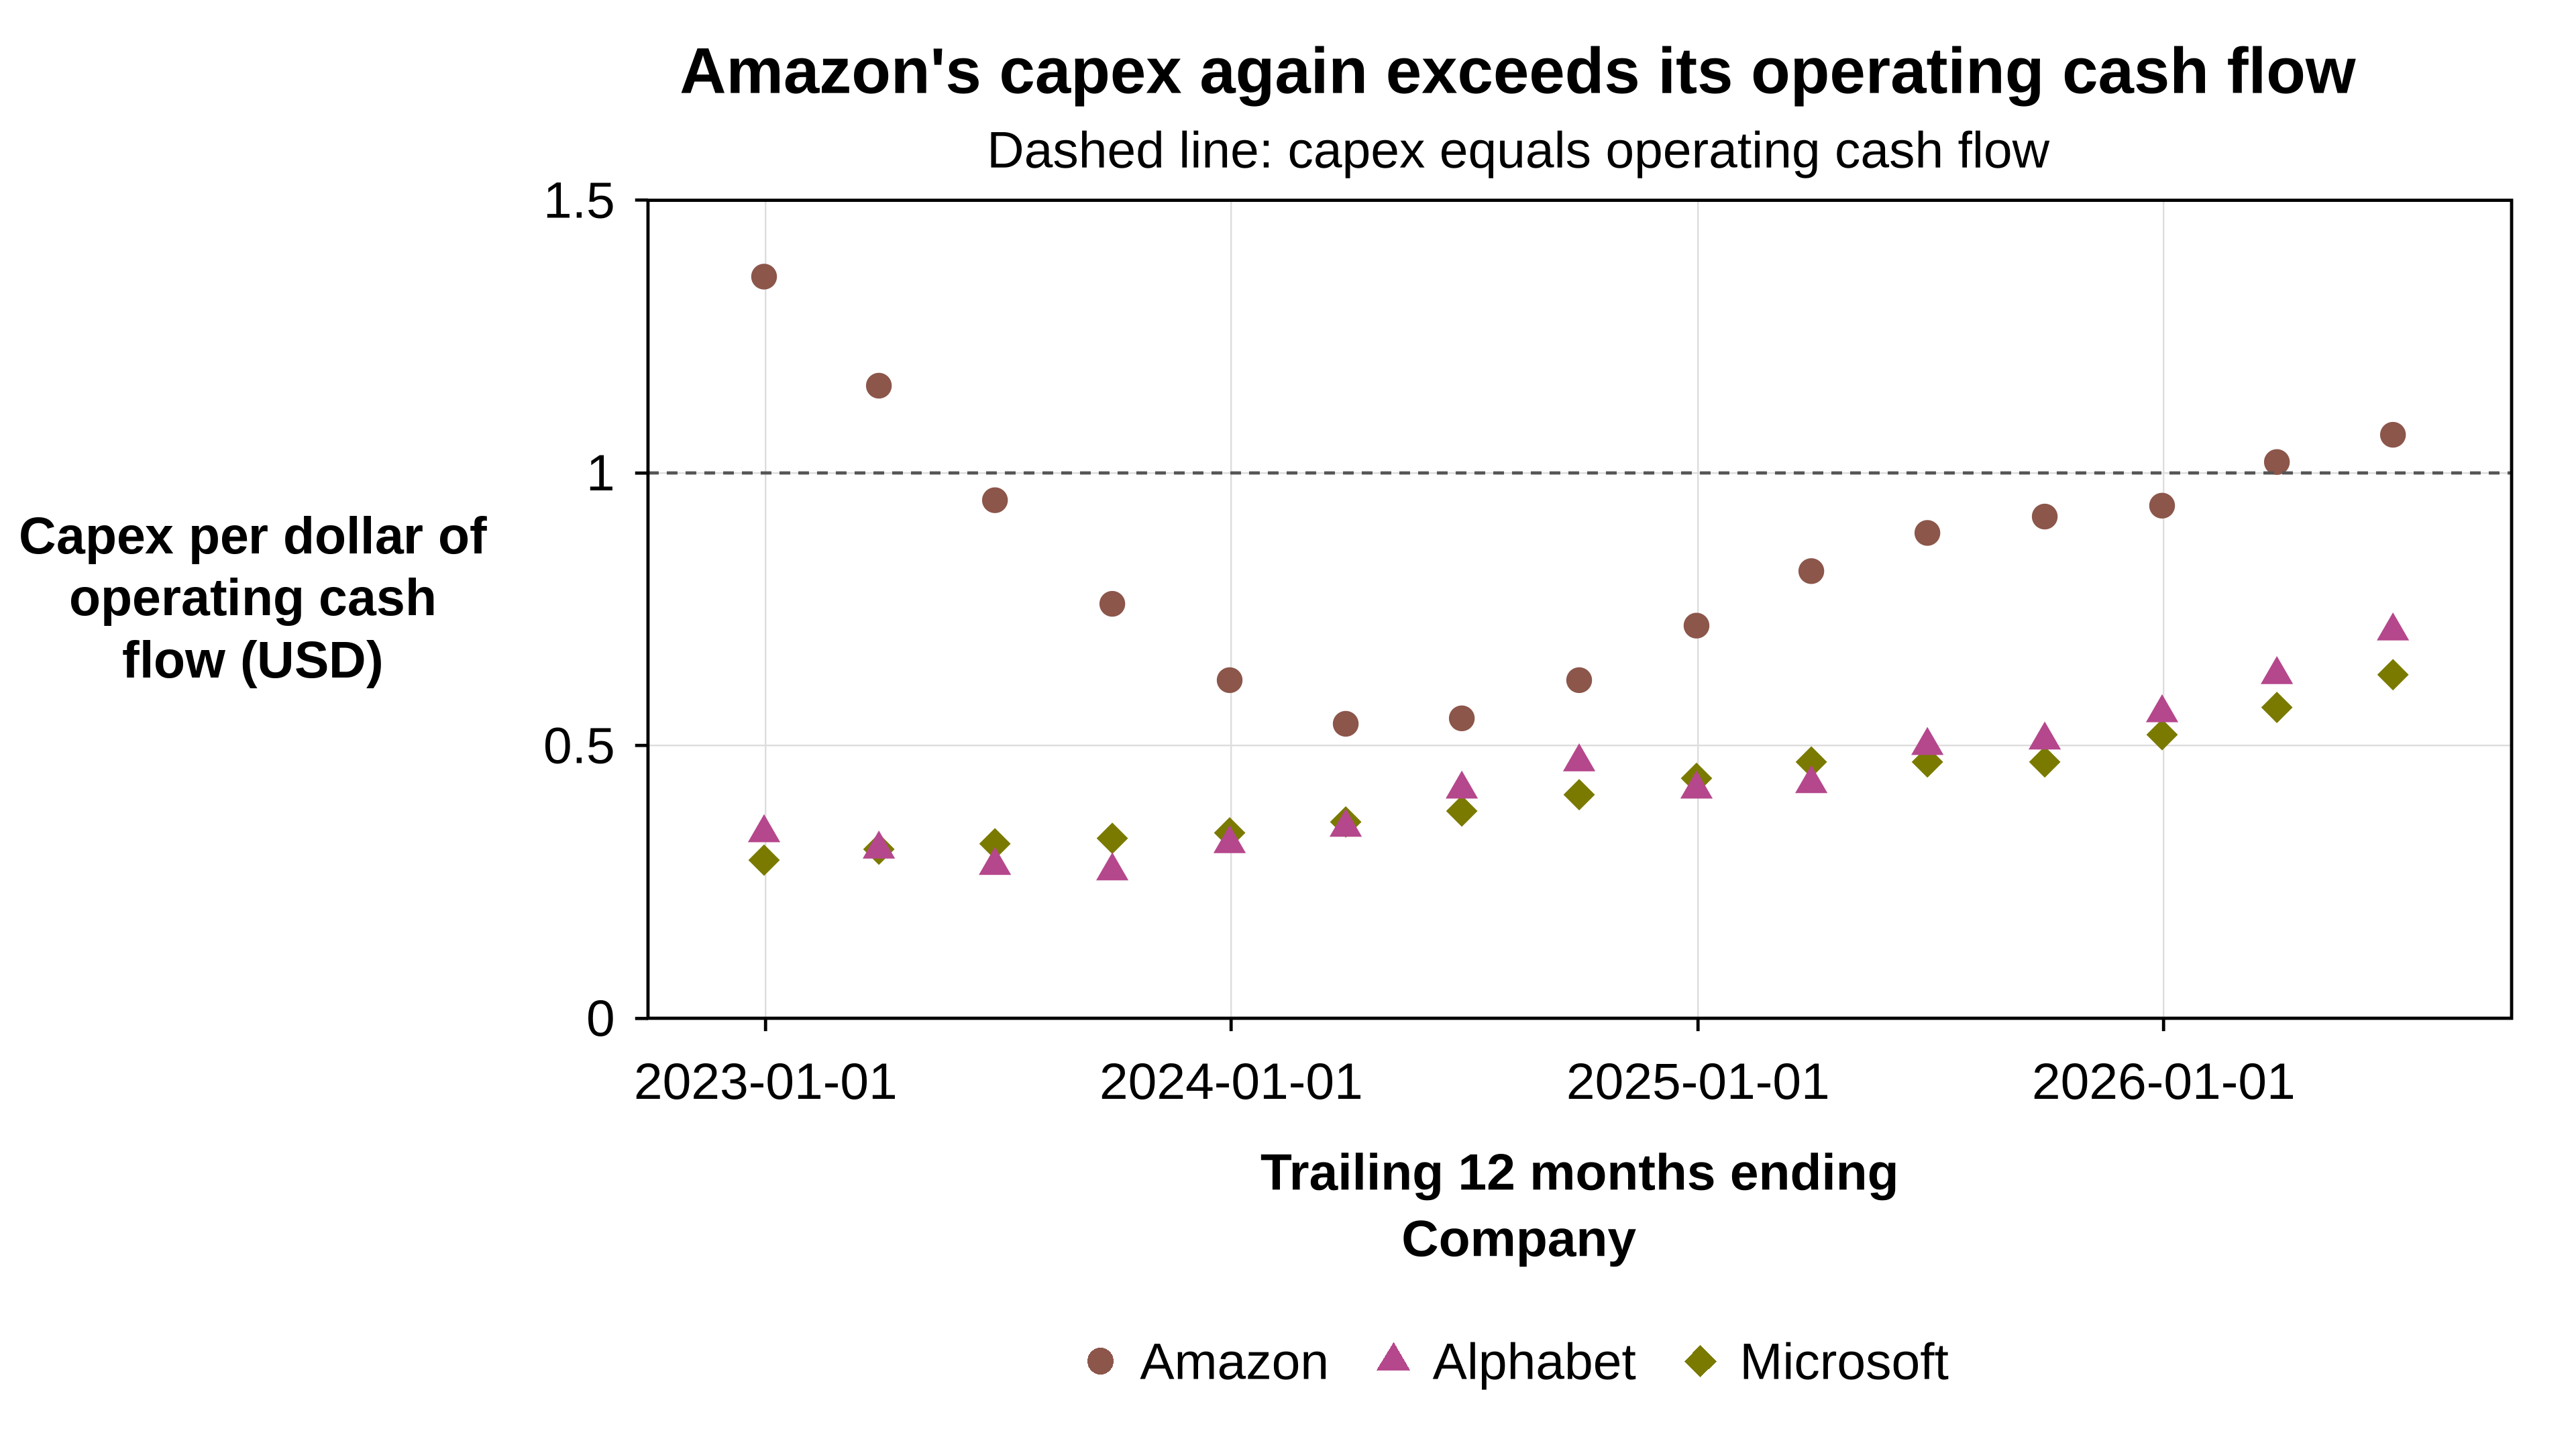
In the 12 months to June 30, 2026, Amazon spent $1.07 on property and equipment for every dollar of operating cash flow ($173.0 billion against $161.4 billion), up from $0.54 in the year to March 2024 and back above 1.0 for the first time since the year to March 2023, while Alphabet rose to $0.71 and Microsoft to $0.63 from roughly $0.30 in early 2023. That leaves Amazon funding part of its buildout from outside operating cash even as its CEO says, per SI News, that AWS capacity is sold out for 2026 and largely for 2027. These filings for three other companies point the same way as the earlier SI Plots chart showing Meta’s capex overtaking its cash generation, using trailing-year cash capex rather than Meta’s quarterly capex including finance leases.
Sources & Notes
- Original story: OpenAI Moves Frontier Training Offline | AWS Capacity Largely Sold Out Through 2027 | Google Ties Gmail and Photos Data to Ads
- Data sources: Amazon.com, Inc (2026). Form 10-Q for the quarterly period ended June 30, 2026; Alphabet Inc (2026). Form 10-Q for the quarterly period ended June 30, 2026; Microsoft Corporation (2026). Form 10-K for the fiscal year ended June 30, 2026
- Other references: U.S. Securities and Exchange Commission (n.d.). EDGAR application programming interfaces (XBRL company concept data); Amazon.com, Inc (2026). Amazon.com announces second quarter results
- Notes: Each point is trailing-12-month cash capex (purchases of, or for Microsoft additions to, property and equipment, gross of asset-sale proceeds) divided by trailing-12-month net cash from operating activities, summed from quarterly values in each company’s 10-Q and 10-K filings as reported in SEC XBRL data; fourth-quarter values are full-year minus nine-month totals, and Microsoft’s fiscal quarters are plotted at their calendar quarter-end dates. Cash capex excludes assets obtained under finance leases (material for Microsoft) and includes non-AI assets; Amazon’s own free-cash-flow measure nets out $4.0 billion of proceeds and incentives, giving $169.0 billion for the year to June 30, 2026. Observation period: years ending 2022-12-31 to 2026-06-30; third-quarter 2026 filings from Amazon, Alphabet and Microsoft were not yet available. Meta is omitted because it was charted on 2026-10-23; on this basis its ratio was 0.79 for the year to 2026-09-30. Data accessed 2026-10-26.
Leave a comment