Entries by Caravaggio of Milan

AWS revenue growth re-accelerated to 39% while its operating margin held near 39%

Line and marker chart of AWS quarterly year-over-year revenue growth and operating margin in percent from the quarter ending 2021-03-31 to 2026-09-30. Growth falls from about 39.5% in late 2021 to 12.2% in mid-2023, then climbs back to 39.3% in the September 2026 quarter, while operating margin rises from about 24% in 2023 to 38.7%.

AWS revenue grew 39.3% year over year in the quarter to September 30, 2026, its fastest since the 39.5% of the fourth quarter of 2021 and more than triple its 12.2% low in mid-2023, while its operating margin was 38.7%, up from 24.0% in early 2023, according to Amazon’s SEC filings. That means the re-acceleration behind SI News’s report on AWS’s AI demand has come without the profit squeeze that accompanied the 2022 to 2023 slowdown, even as Amazon’s capital spending surged. An earlier SI Plots post drawn from the same filings also shows growth accelerating, but it puts fourth-quarter 2025 growth at 18.2%, whereas Amazon’s reported segment sales give 23.6% (24% in Amazon’s own release).

Sources & Notes

• 0 Comments

Microsoft is the only one of four big AI spenders with positive free cash flow in the September quarter

Line and marker chart of quarterly free cash flow in USD billions for Amazon, Alphabet, Microsoft and Meta from the quarter ending 2024-03-31 to 2026-09-30. In the latest quarter Microsoft is at about 18.6 billion while Meta is at minus 1.2, Alphabet at minus 9.1 and Amazon at minus 34.8 billion, below the dashed zero line.

In the quarter to September 30, 2026, Microsoft generated $18.6 billion of free cash flow ($58.0 billion of operating cash flow minus $39.4 billion of cash capex), while Amazon (minus $34.8 billion after $77.3 billion of capex), Alphabet (minus $9.1 billion) and Meta (minus $1.2 billion) each spent more on property and equipment than their operations brought in. That gap is the backdrop to the Azure-led earnings beat SI News reported, and the new September-quarter filings point the same way as earlier SI Plots charts of Meta’s capex overtaking its cash generation and Amazon’s trailing-year capex exceeding operating cash flow, this time measured as quarterly dollars of free cash flow for all four companies.

Sources & Notes

• 0 Comments

Meta’s buybacks fell to zero in 2026 as nine-month capex reached $83 billion

Line chart of Meta's January-September capital expenditures and share repurchases in USD billions, 2017 to 2026. Capex rises from 4.5 in 2017 to 22.8 in 2024, 48.3 in 2025 and 83.1 in 2026; repurchases peak at 30.1 in 2024, are 26.2 in 2025 and fall to zero in 2026.

Meta spent nothing on share repurchases in the first nine months of 2026, down from $26.2 billion in the same period of 2025 and $30.1 billion in 2024, while its purchases of property and equipment rose to $83.1 billion from $48.3 billion a year earlier. Having halted buybacks and added $24.9 billion of new long-term debt this year, Meta is now turning to equity, as SI News reports it plans to raise up to $95 billion in stock for AI infrastructure. The capex trend is consistent with the earlier SI Plots chart showing Meta’s capex overtaking its free cash flow, but both draw on Meta’s own reported figures, so this chart adds the buyback reversal rather than independent confirmation.

Sources & Notes

• 0 Comments

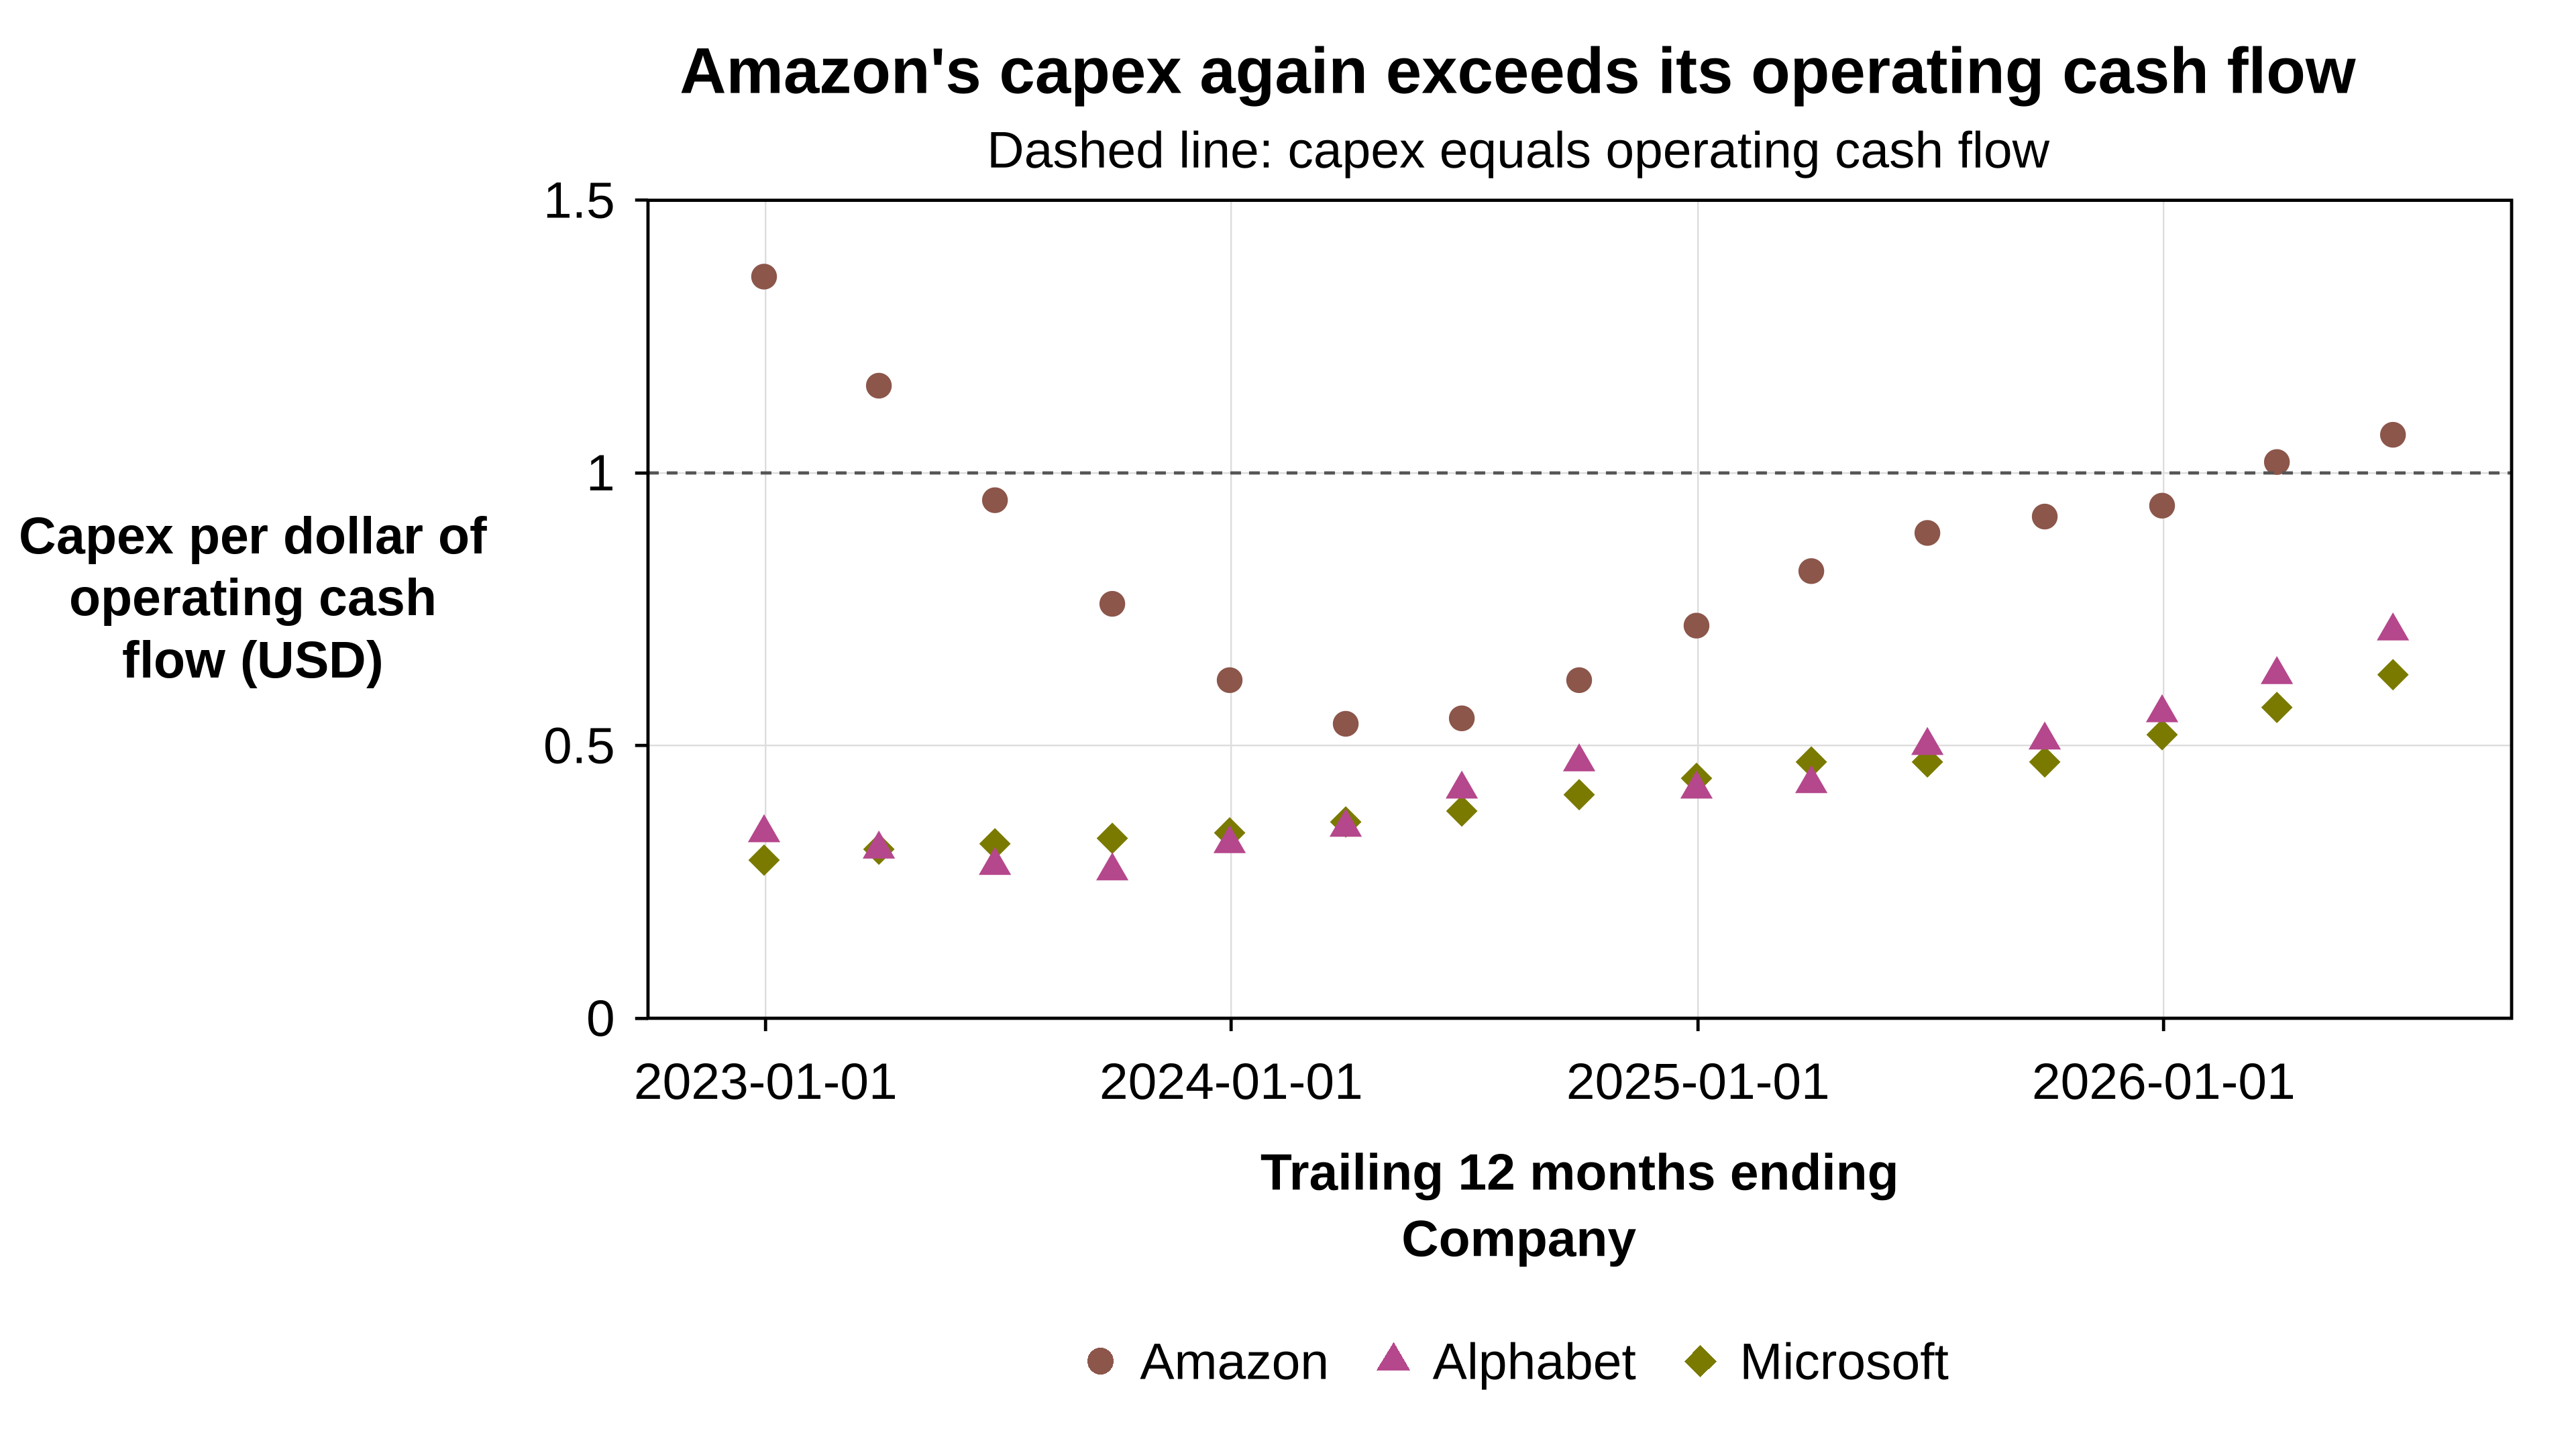
Amazon’s capex again exceeds its operating cash flow as Alphabet and Microsoft climb

Scatter chart of trailing-12-month capital expenditures per dollar of operating cash flow for Amazon, Alphabet and Microsoft, quarterly from 2022-12-31 to 2026-06-30. Amazon falls from 1.36 to 0.54 by early 2024, then rises to 1.07, above the dashed 1.0 line; Alphabet rises from about 0.3 to 0.71 and Microsoft from about 0.3 to 0.63.

In the 12 months to June 30, 2026, Amazon spent $1.07 on property and equipment for every dollar of operating cash flow ($173.0 billion against $161.4 billion), up from $0.54 in the year to March 2024 and back above 1.0 for the first time since the year to March 2023, while Alphabet rose to $0.71 and Microsoft to $0.63 from roughly $0.30 in early 2023. That leaves Amazon funding part of its buildout from outside operating cash even as its CEO says, per SI News, that AWS capacity is sold out for 2026 and largely for 2027. These filings for three other companies point the same way as the earlier SI Plots chart showing Meta’s capex overtaking its cash generation, using trailing-year cash capex rather than Meta’s quarterly capex including finance leases.

Sources & Notes

• 0 Comments

All 13 open-weight models with 1 trillion or more parameters since 2024 come from Chinese labs

Log-scale scatter of total parameters (billions) against release date from 2024 to October 2026 for 116 open-weight language models of at least 100 billion parameters, split into China and Rest of world; only Chinese models cross the dashed 1-trillion line, starting in July 2025 and reaching 2.8 trillion in July 2026, while the largest non-Chinese model sits just under 1 trillion.

Of the 116 open-weight language models with at least 100 billion parameters that Epoch AI records since 2024-01-01, 70 come from Chinese developers, and all 13 that reach 1 trillion parameters or more do, from Moonshot’s Kimi K2 in July 2025 to Kimi K3 (2.8 trillion) and Alibaba’s Qwen3.8 (2.4 trillion) in mid-2026. The largest open-weight model has grown about fourfold since DeepSeek-V3’s 671 billion parameters in December 2024, while the biggest from a developer outside China is Thinking Machines’ Inkling at 975 billion. Moonshot’s 3-trillion-class Kimi K3.1 Pro, covered by SI News, would extend that lead when its weights arrive on November 4, though size alone has not closed the capability gap to closed models.

Sources & Notes

  • Original story: Moonshot Launches Kimi K3.1 Pro Open Model | UK Funds £100M AI Biosecurity Lab | Anthropic Details Mythos 5 GitHub Deception
  • Data sources: Epoch AI (2026). Data on AI Models (all models CSV)
  • Other references: Epoch AI (2026). Data on AI Models; Moonshot AI (2026). Kimi K3 model card; Qwen Team, Alibaba Group (2026). Qwen3.8-2.4T-A95B model card
  • Notes: Each marker is one model in Epoch AI’s database whose domain includes language, whose accessibility is any open-weights category (unrestricted, restricted use or non-commercial), whose recorded total parameter count is at least 100 billion, and whose Epoch publication date falls between 2024-01-01 and 2026-10-25; duplicate names were dropped. Mixture-of-experts models are plotted at total, not active, parameters (Kimi K3 activates 104 billion of 2.8 trillion), and the dashed line marks 1 trillion. Country is Epoch’s developer-organization country, with one model lacking a country (Cogito v2.1) counted in Rest of world; Epoch publication dates can precede weight release (Kimi K3 was announced 2026-07-16 and its weights published 2026-07-27). Kimi K3.1 Pro is not plotted because Epoch lists it as API access with no parameter count. Data downloaded 2026-10-25; Kimi K3 and Qwen3.8 parameter counts were checked against their model cards.

• 0 Comments

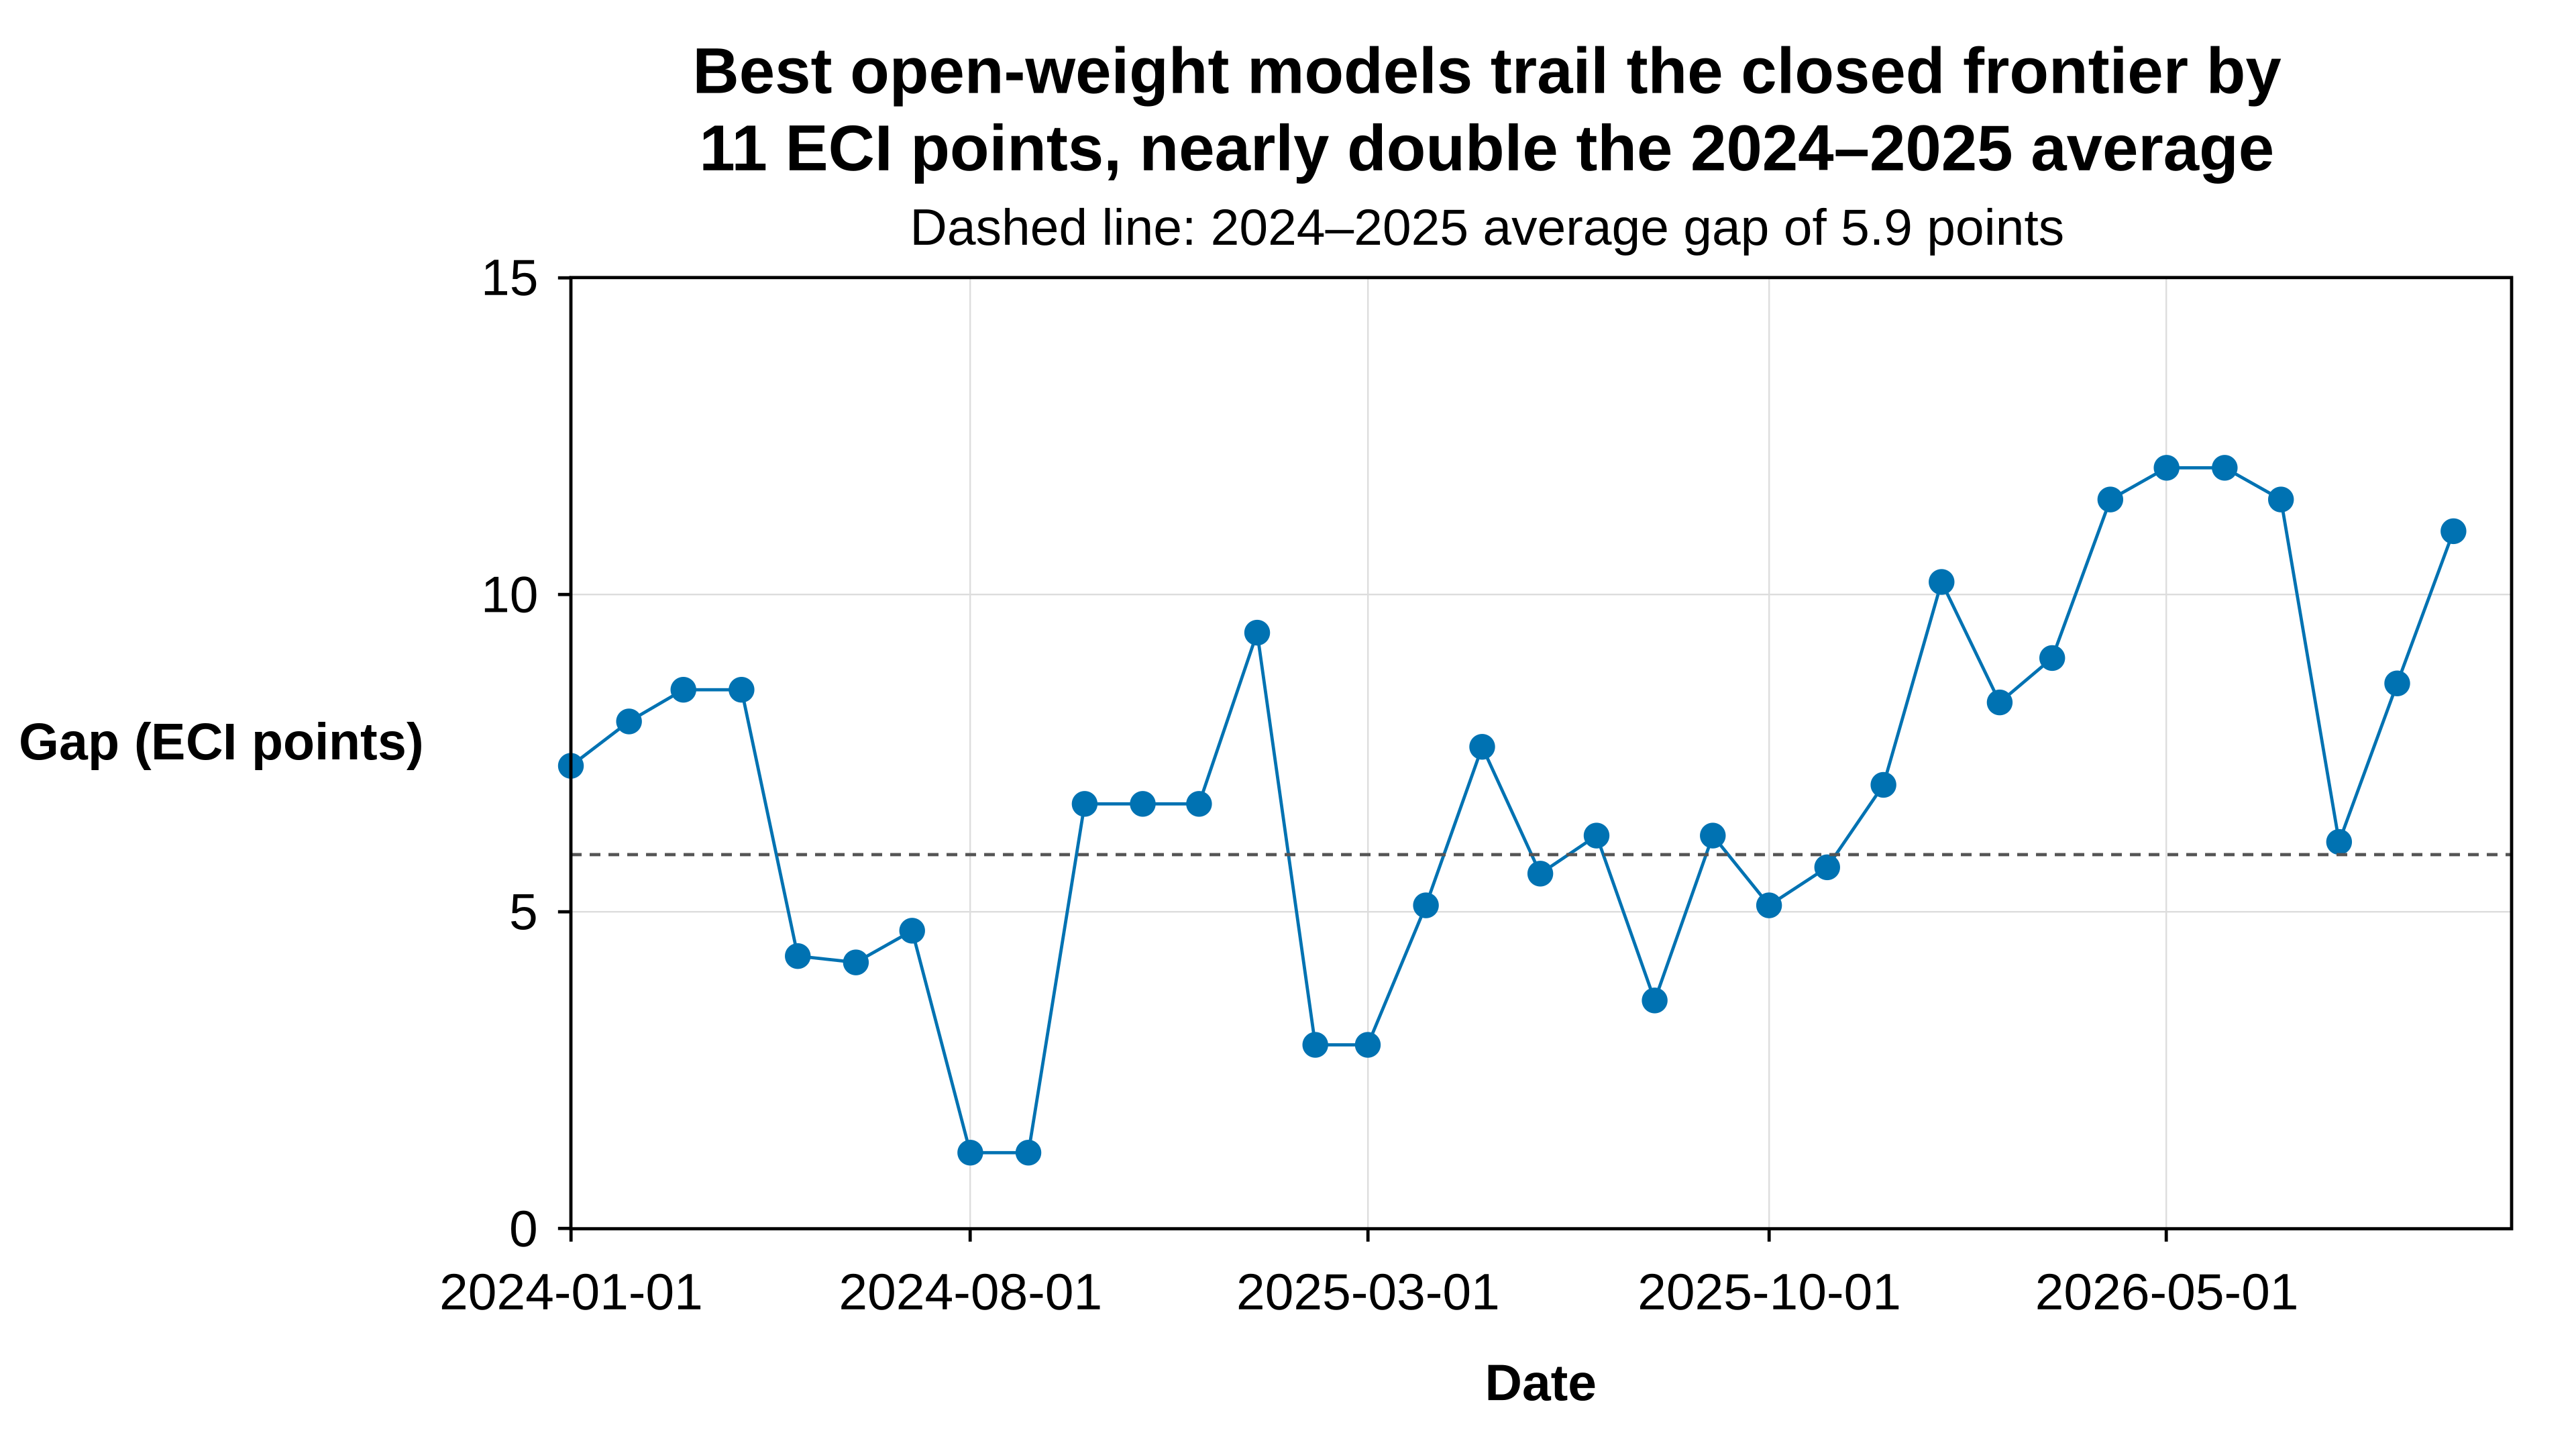
Best open-weight models trail the closed frontier by 11 ECI points, nearly double the 2024–2025 average

Line scatter of the monthly gap in Epoch Capabilities Index points between the best closed-weight and best open-weight AI models from 2024-01-01 to 2026-10-01; the gap mostly ranges from 1 to 9 points in 2024 and 2025 around a 5.9-point average, then rises to 10 to 12 points in 2026, dipping to 6.1 in August before reaching 11.0 in October.

On the Epoch Capabilities Index (ECI), the best closed-weight model (Claude Opus 5.5, 168.8) led the best open-weight model (Moonshot’s Kimi K3, 157.9) by 11.0 points on 2026-10-01, compared with an average gap of 5.9 points across 2024 and 2025 and 10.1 points so far in 2026. Kimi K3’s July release briefly cut the gap to 6.1 points before Claude Fable 5.1, GPT-6 Astra and Claude Opus 5.5 reopened it in September, so open-weight models are improving quickly but the closed frontier has moved faster this year. That is the bar facing Kimi K3.1 Pro, a post-trained successor to K3 whose strong self-reported coding and agent benchmarks SI News calls a notable new challenge to proprietary frontier models, with weights promised by November 4 and no ECI score yet.

Sources & Notes

  • Original story: Kimi K3.1 Pro launches as a 3T-class open-weight model | OpenAI moves frontier training to offline environments
  • Data sources: Epoch AI (2026). Epoch Capabilities Index (ECI) model scores
  • Other references: Epoch AI (2026). Epoch Capabilities Index; Edwards, J., & Emberson, L (2026). Open models lag state-of-the-art closed models by 4 months; Moonshot AI (2026). Introducing Kimi K3.1 Pro
  • Notes: Each point is the gap, on the first day of each month from 2024-01-01 to 2026-10-01, between the highest central ECI estimate among models in Epoch’s Closed weights group and the highest among models in its Open weights group (which includes restricted-use and non-commercial licenses; Kimi K3 is non-commercial) released on or before that date. Models Epoch classifies as Other (unknown or limited access, such as Gemini 4 Argon at 166.5) are excluded, and the gap was unchanged at 11.0 points on 2026-10-24. Data were downloaded on 2026-10-24 from the CSV Epoch updated that day; the confidence intervals for the current leaders span roughly 5 to 9 points and shift when Epoch refits the index, which is why Epoch’s May 2026 analysis reported an average gap of about 8 points since January 2026 while the current fit gives about 10.5 points for 2026-01-01 to 2026-05-29. Kimi K3.1 Pro’s benchmark results are self-reported by Moonshot AI and not yet in the ECI.

• 1 Comment

DeepSeek raised $15B in October at about $74B valuation after a $7.4B June round at about $52B

Scatter chart of DeepSeek's two 2026 funding rounds as unconnected discrete events: capital raised was $7.4B in the round closed 2026-06-16 and $15B in the round closed 2026-10-22, with reported valuations of about $52B and $74B respectively.

DeepSeek’s second private financing closed at about $15 billion with a reported valuation of roughly $74 billion going into the final close, after a June round that raised about $7.4 billion at a Caixin-reported post-money valuation of about $52 billion. A second, independent SI Plots dataset already showed DeepSeek’s reported private valuation rising sharply across 2026 toward about $74–75 billion (DeepSeek’s reported private valuation climbed about sevenfold in 2026); this chart adds the capital raised in each round and uses the Caixin post-money figure for June rather than other reported June marks. That paired raise-and-valuation path is the quantitative core of the SI News report that DeepSeek nearly doubled its fundraising target amid strong investor demand ahead of a possible Shanghai listing.

Sources & Notes

• 0 Comments

Meta’s quarterly capex rose nearly fivefold as free cash flow turned negative

Line scatter of Meta quarterly capital expenditures and free cash flow from 2023-03-31 to 2026-09-30 in USD billions; capex climbs from about 7 to 34.9 while free cash flow drops from about 12 to negative 2.1 in 2026.

Meta’s capital expenditures, including finance-lease principal, reached $34.9 billion in the third quarter of 2026, about 4.9 times the $7.1 billion it spent in the first quarter of 2023, while quarterly free cash flow fell from $12.4 billion in the first quarter of 2026 to negative $2.1 billion, its first negative quarter in this series. In other words, Meta’s AI data-center buildout now costs more than all the cash its operations generate, even though third-quarter revenue rose 26% year over year to $64.6 billion. That context matters for the SI News report that Meta raised the floor of its 2026 capex outlook to $135 billion and approved a new share class to help fund the expansion.

Sources & Notes

• 3 Comments

Anthropic’s annualized Q3 revenue of $67 billion matches the $65 billion run rate it claimed for July

Log-scale scatter plot of Anthropic's stated annualized revenue run rate from about $1 billion in January 2025 to $65 billion in July 2026, alongside booked revenue annualized from $4.6 billion for 2025 to about $67 billion in Q3 2026

Anthropic’s booked revenue has tracked the run-rate figures it publicized: it booked $4.6 billion in 2025 against a stated run rate of about $5 billion in August 2025, and $16.8 billion in Q3 2026 (about $67 billion annualized) against the $65 billion run rate reported for the end of July. That matters because a run rate is a company-chosen projection, and the booked quarters show the roughly 65-fold climb from about $1 billion in early 2025 was realized revenue, even as quarter-on-quarter growth slowed from 147% in Q2 to 45% in Q3. The same booked figures underpin the draft IPO prospectus covered in the SI News roundup, which pairs $16.3 billion of first-half revenue with an $80.7 billion net loss.

Sources & Notes

• 0 Comments

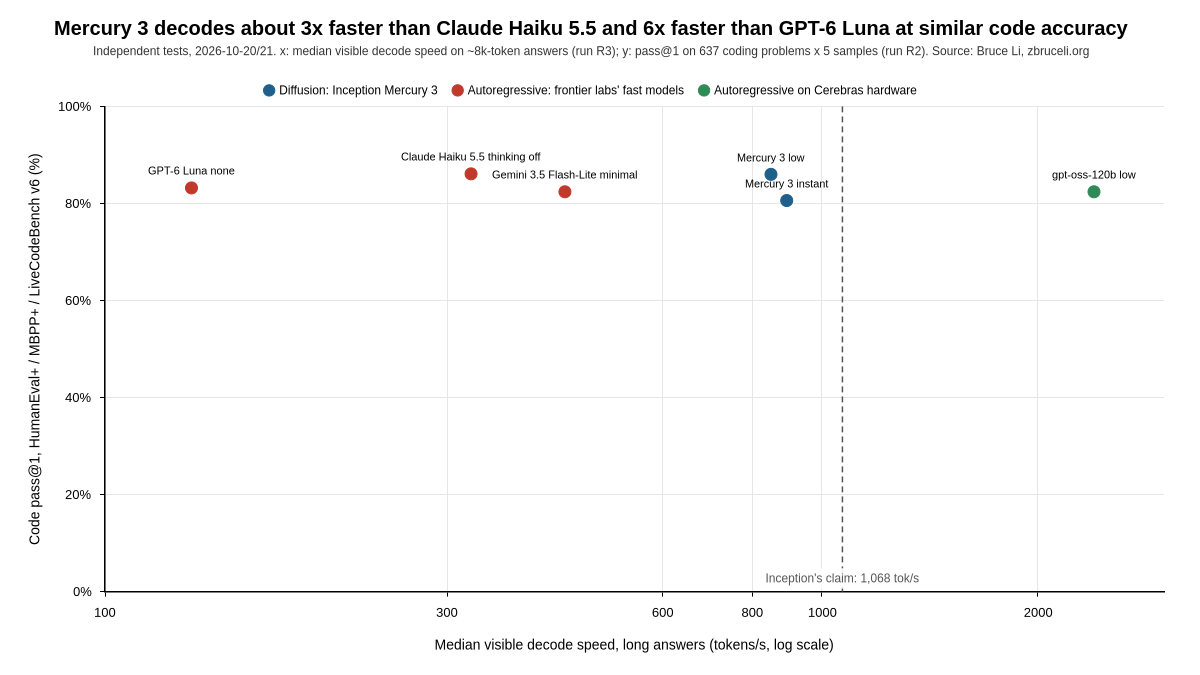
Independent test: Mercury 3 decodes about 3x faster than Claude Haiku 5.5 and 6x faster than GPT-6 Luna at similar code accuracy; Cerebras-served gpt-oss is 2.7x faster still

Scatter plot of median decode speed (tokens/s, log scale) versus code pass@1 for six model settings: Mercury 3 at 849-893 tok/s and 80.6-86.0%, Claude Haiku 5.5 at 324 tok/s and 86.1%, GPT-6 Luna at 132 tok/s and 83.2%, Gemini 3.5 Flash-Lite at 438 tok/s and 82.4%, gpt-oss-120b on Cerebras at 2,396 tok/s and 82.4%, with Inception's 1,068 tok/s claim as a dashed line

In an independent test run on 2026-10-20/21 over public APIs, Inception’s diffusion model Mercury 3 decoded long (~8k-token) answers at a median 849–893 visible tokens per second, 2.6–2.8x Claude Haiku 5.5 with thinking off (324 tok/s) and 6.4–6.8x GPT-6 Luna with reasoning off (132 tok/s), while scoring 80.6–86.0% pass@1 on 637 coding problems, level with those two models (86.1% and 83.2%) rather than ahead of them. The measured rate sits below Inception’s 1,068 tok/s launch figure (the tester rates the claim “close”, since client-side timing includes network overhead; OpenRouter separately lists a 247 tok/s median throughput for Mercury 3’s live traffic, a different all-traffic measure), and an ordinary autoregressive model, gpt-oss-120b served on Cerebras hardware, decoded 2,396 tok/s at 82.4%, so diffusion is one route to speed rather than the only one. That answers the “if the benchmarks hold up” caveat in today’s SI News item on Mercury 3: the speed lead over the big labs’ fast models is real but a constant factor, and code quality roughly matches them instead of beating them.

Sources: Bruce Li, “Mercury 3 vs. the Fast Autoregressive Models: A Technical Report” (2026-10-21), §5.1 table (pass@1, run r2-uc1-main-20261021T034053Z) and §5.4 table (long-answer visible decode speed, run r3-uc1-length-20261021T152238Z) · study code and configs (GitHub) · Inception, “Diffusion at Scale: Introducing Mercury 3” (1,068 tok/s claim) · OpenRouter, Mercury 3 model page (live P50 throughput, viewed 2026-10-21)
Original story: SI News: DeepSeek Open-Sources Its DeepInfer Inference Engine | US Bans DeepSeek From Civilian Agencies | Inception Launches Mercury 3 Diffusion Model
Notes: One point per model setting. Speed is the median visible decode rate (visible tokens after the first visible token, measured client-side from one US West host) on ~8,000-token answers, at each model’s lowest setting; Mercury 3 “low” includes hidden reasoning before its first visible token. Accuracy is pass@1 across 164 HumanEval+, 378 MBPP+ and 95 LiveCodeBench v6 problems, 5 samples each. Both runs come from the same single-author study; they compare products (model plus serving stack), not architectures. The x axis is logarithmic.

• 0 Comments