Entries for October 2026

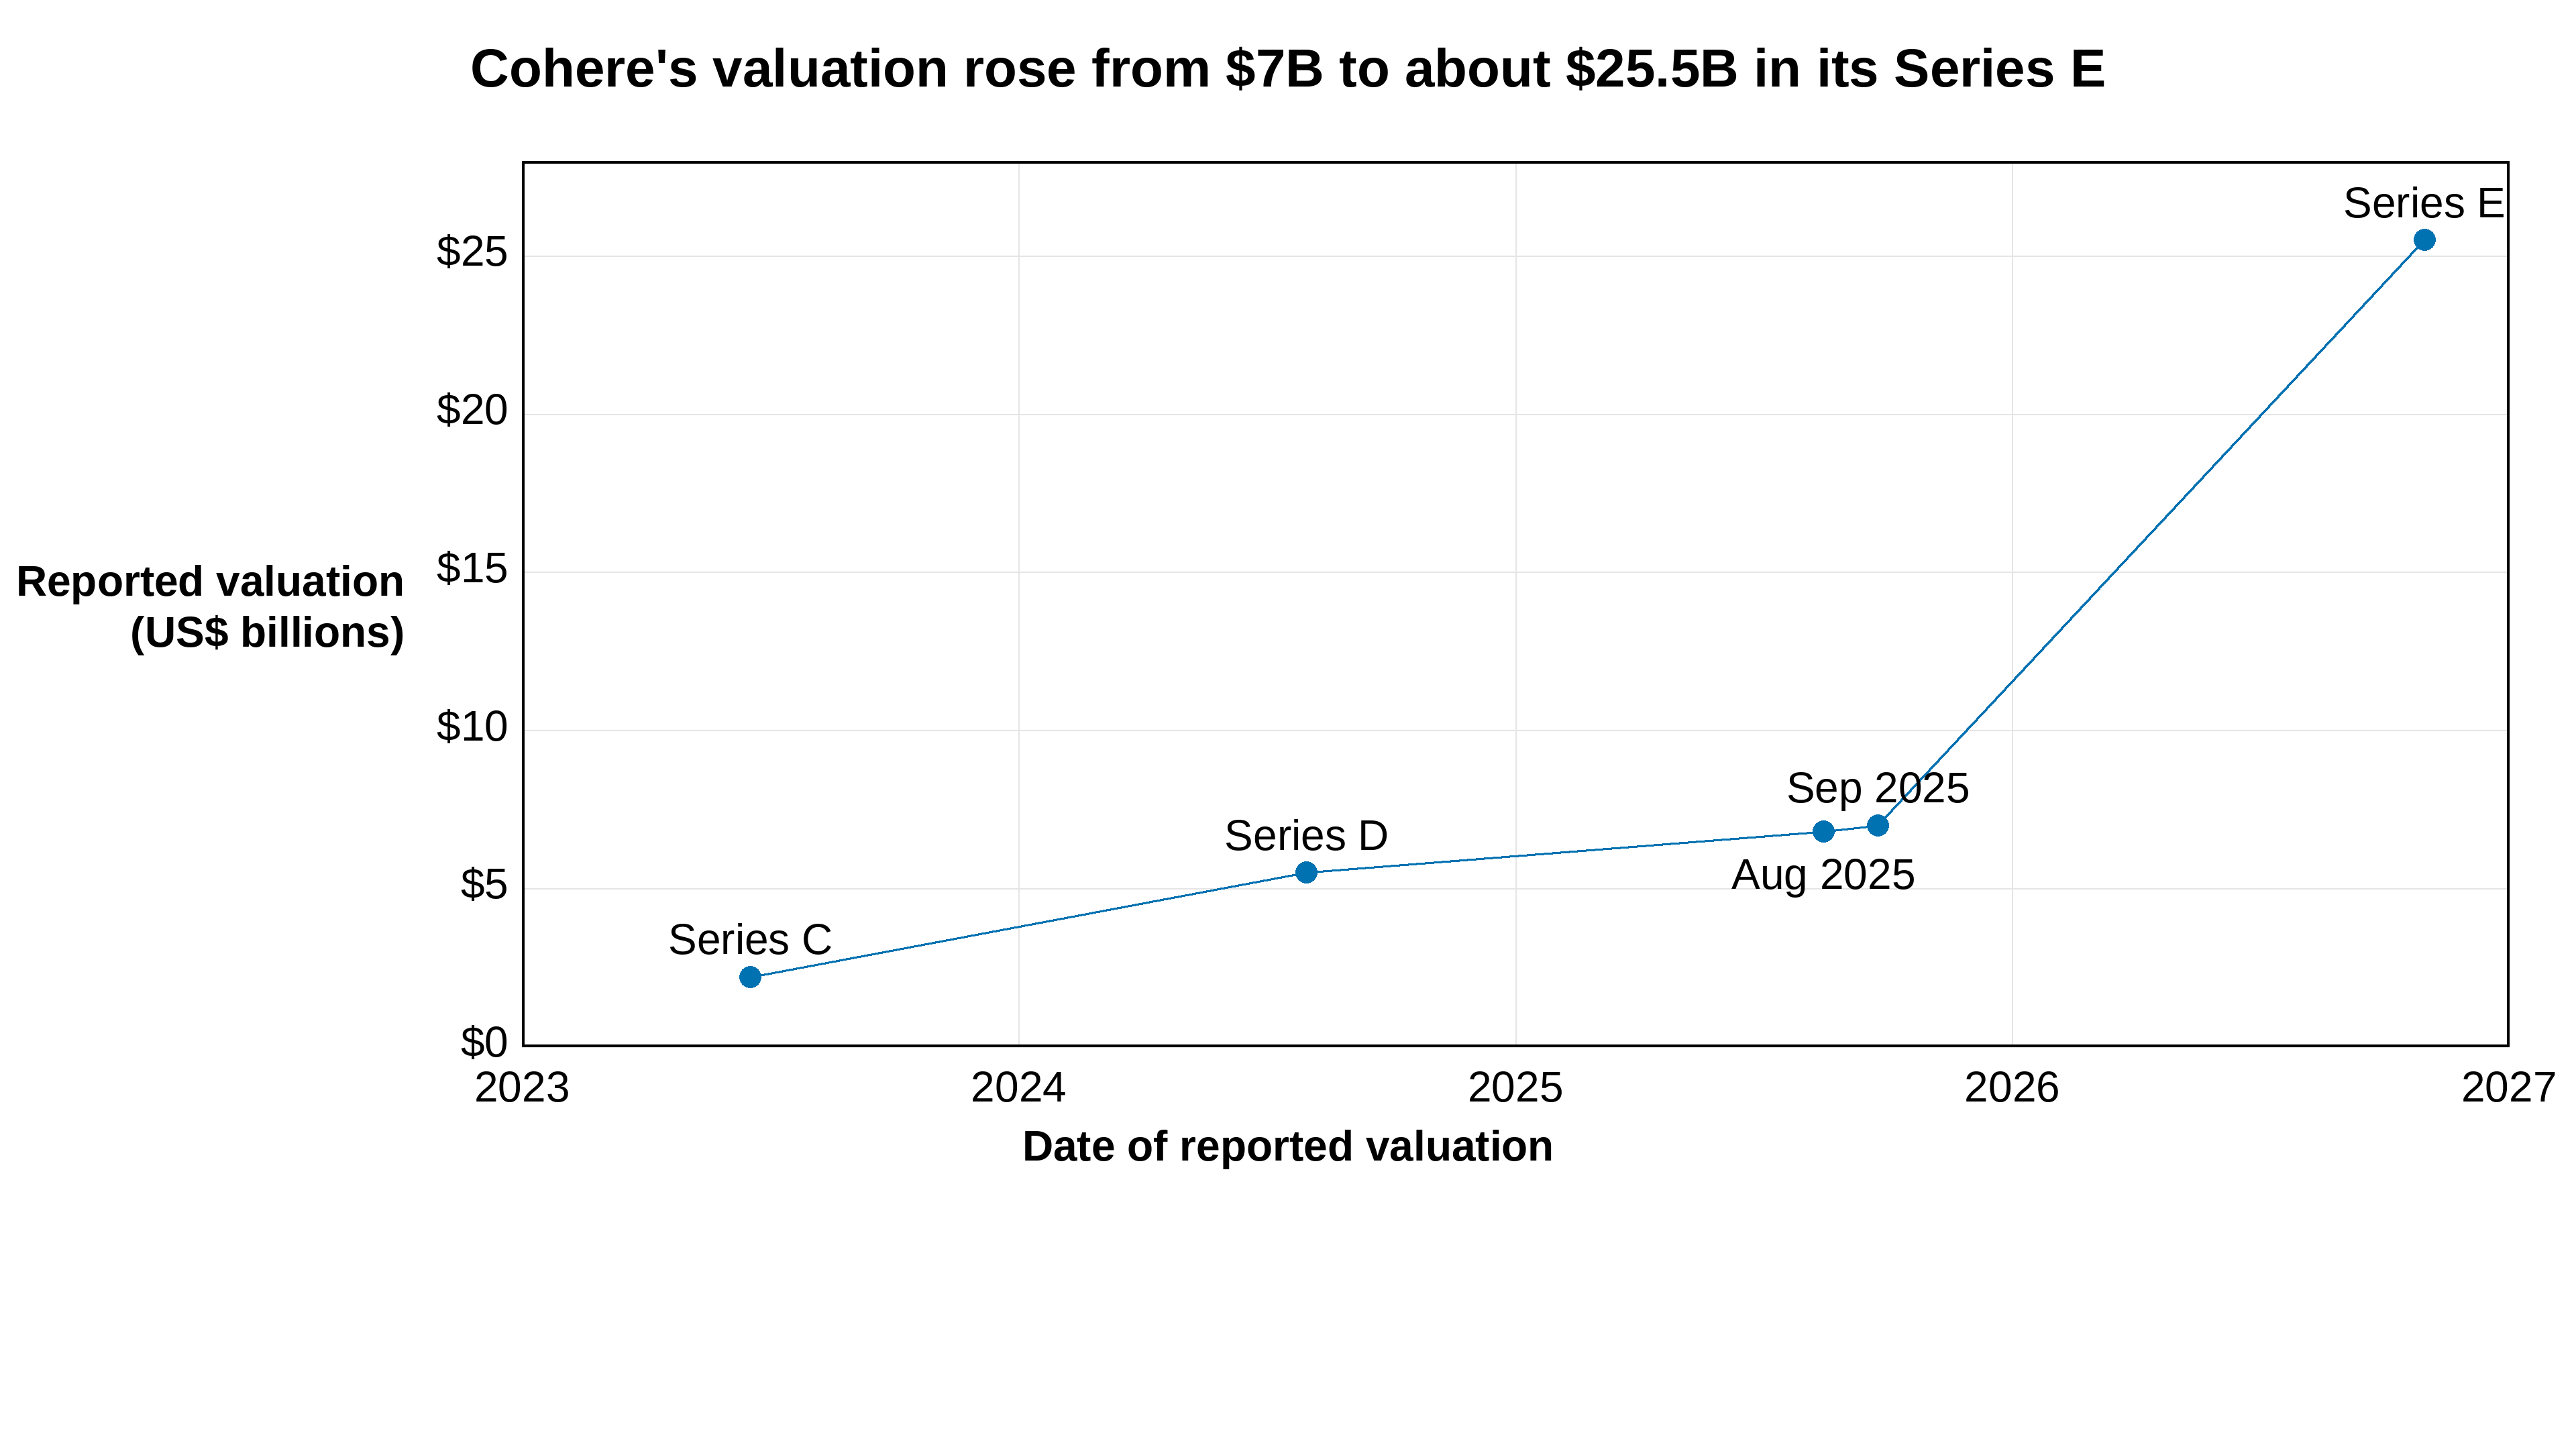
Cohere’s valuation rose from $7B to about $25.5B in its Series E

Scatter plot: Cohere's reported valuation over time, from Series C in 2023 to Series E in 2026

Cohere’s reported valuation climbed from about $2.2 billion at its Series C in June 2023 to about $7 billion after a September 2025 extension, then jumped to about $25.5 billion with the Series E announced October 29, 2026 — more than tripling in a single step. The Series E, targeting up to C$7 billion with the Government of Canada taking an equity stake of up to C$1.6 billion, is the largest private financing ever undertaken by a Canadian technology company, and it extends the SI News story of Canada’s sovereign-AI bet from a funding announcement into a valuation trajectory.

Sources & Notes

  • Original story: Mistral Opens Large 4 Open Weights | Canada Takes Stake in Cohere’s Record Round | AWS Growth Hits 39% on AI Demand
  • Data sources: Cohere (2026). Cohere Announces Series E Fundraise Targeting CAD $7 Billion to Meet Surging Global Demand for Secure, Sovereign AI — Cohere Series E announcement (via PR Newswire); TechCrunch (2025). Cohere hits $7B valuation a month after its last raise — TechCrunch; PitchBook (2025). Cohere’s new $6.8B valuation confirms that the AI frenzy isn’t over — PitchBook; Dow Jones Newswires via Morningstar (2026). Canada to Take Equity Stake in AI Firm Cohere — Morningstar
  • Notes: Valuations are as reported at each dated milestone, not audited figures. The Series E point is the valuation at the full C$7 billion target (C$35.7 billion), converted to about US$25.5 billion at roughly C$0.71 per US$1 (the C$7 billion target is about US$5 billion per Dow Jones reporting); Cohere has announced only an initial close, has not disclosed how much was secured at that close, and has not disclosed whether the C$35.7 billion figure is pre- or post-money, so the final valuation will depend on how much of the target closes. Earlier valuations are reported post-money figures: Series C about US$2.2 billion (June 2023, TechCrunch), Series D US$5.5 billion (July 2024), August 2025 US$6.8 billion, September 2025 extension about US$7 billion. The connecting line joins successive dated valuations for readability; it does not imply valuations between those dates. The reported April/September 2026 talks of a US$20 billion valuation were not used, as they were unconfirmed reports rather than announced terms.
• 0 Comments

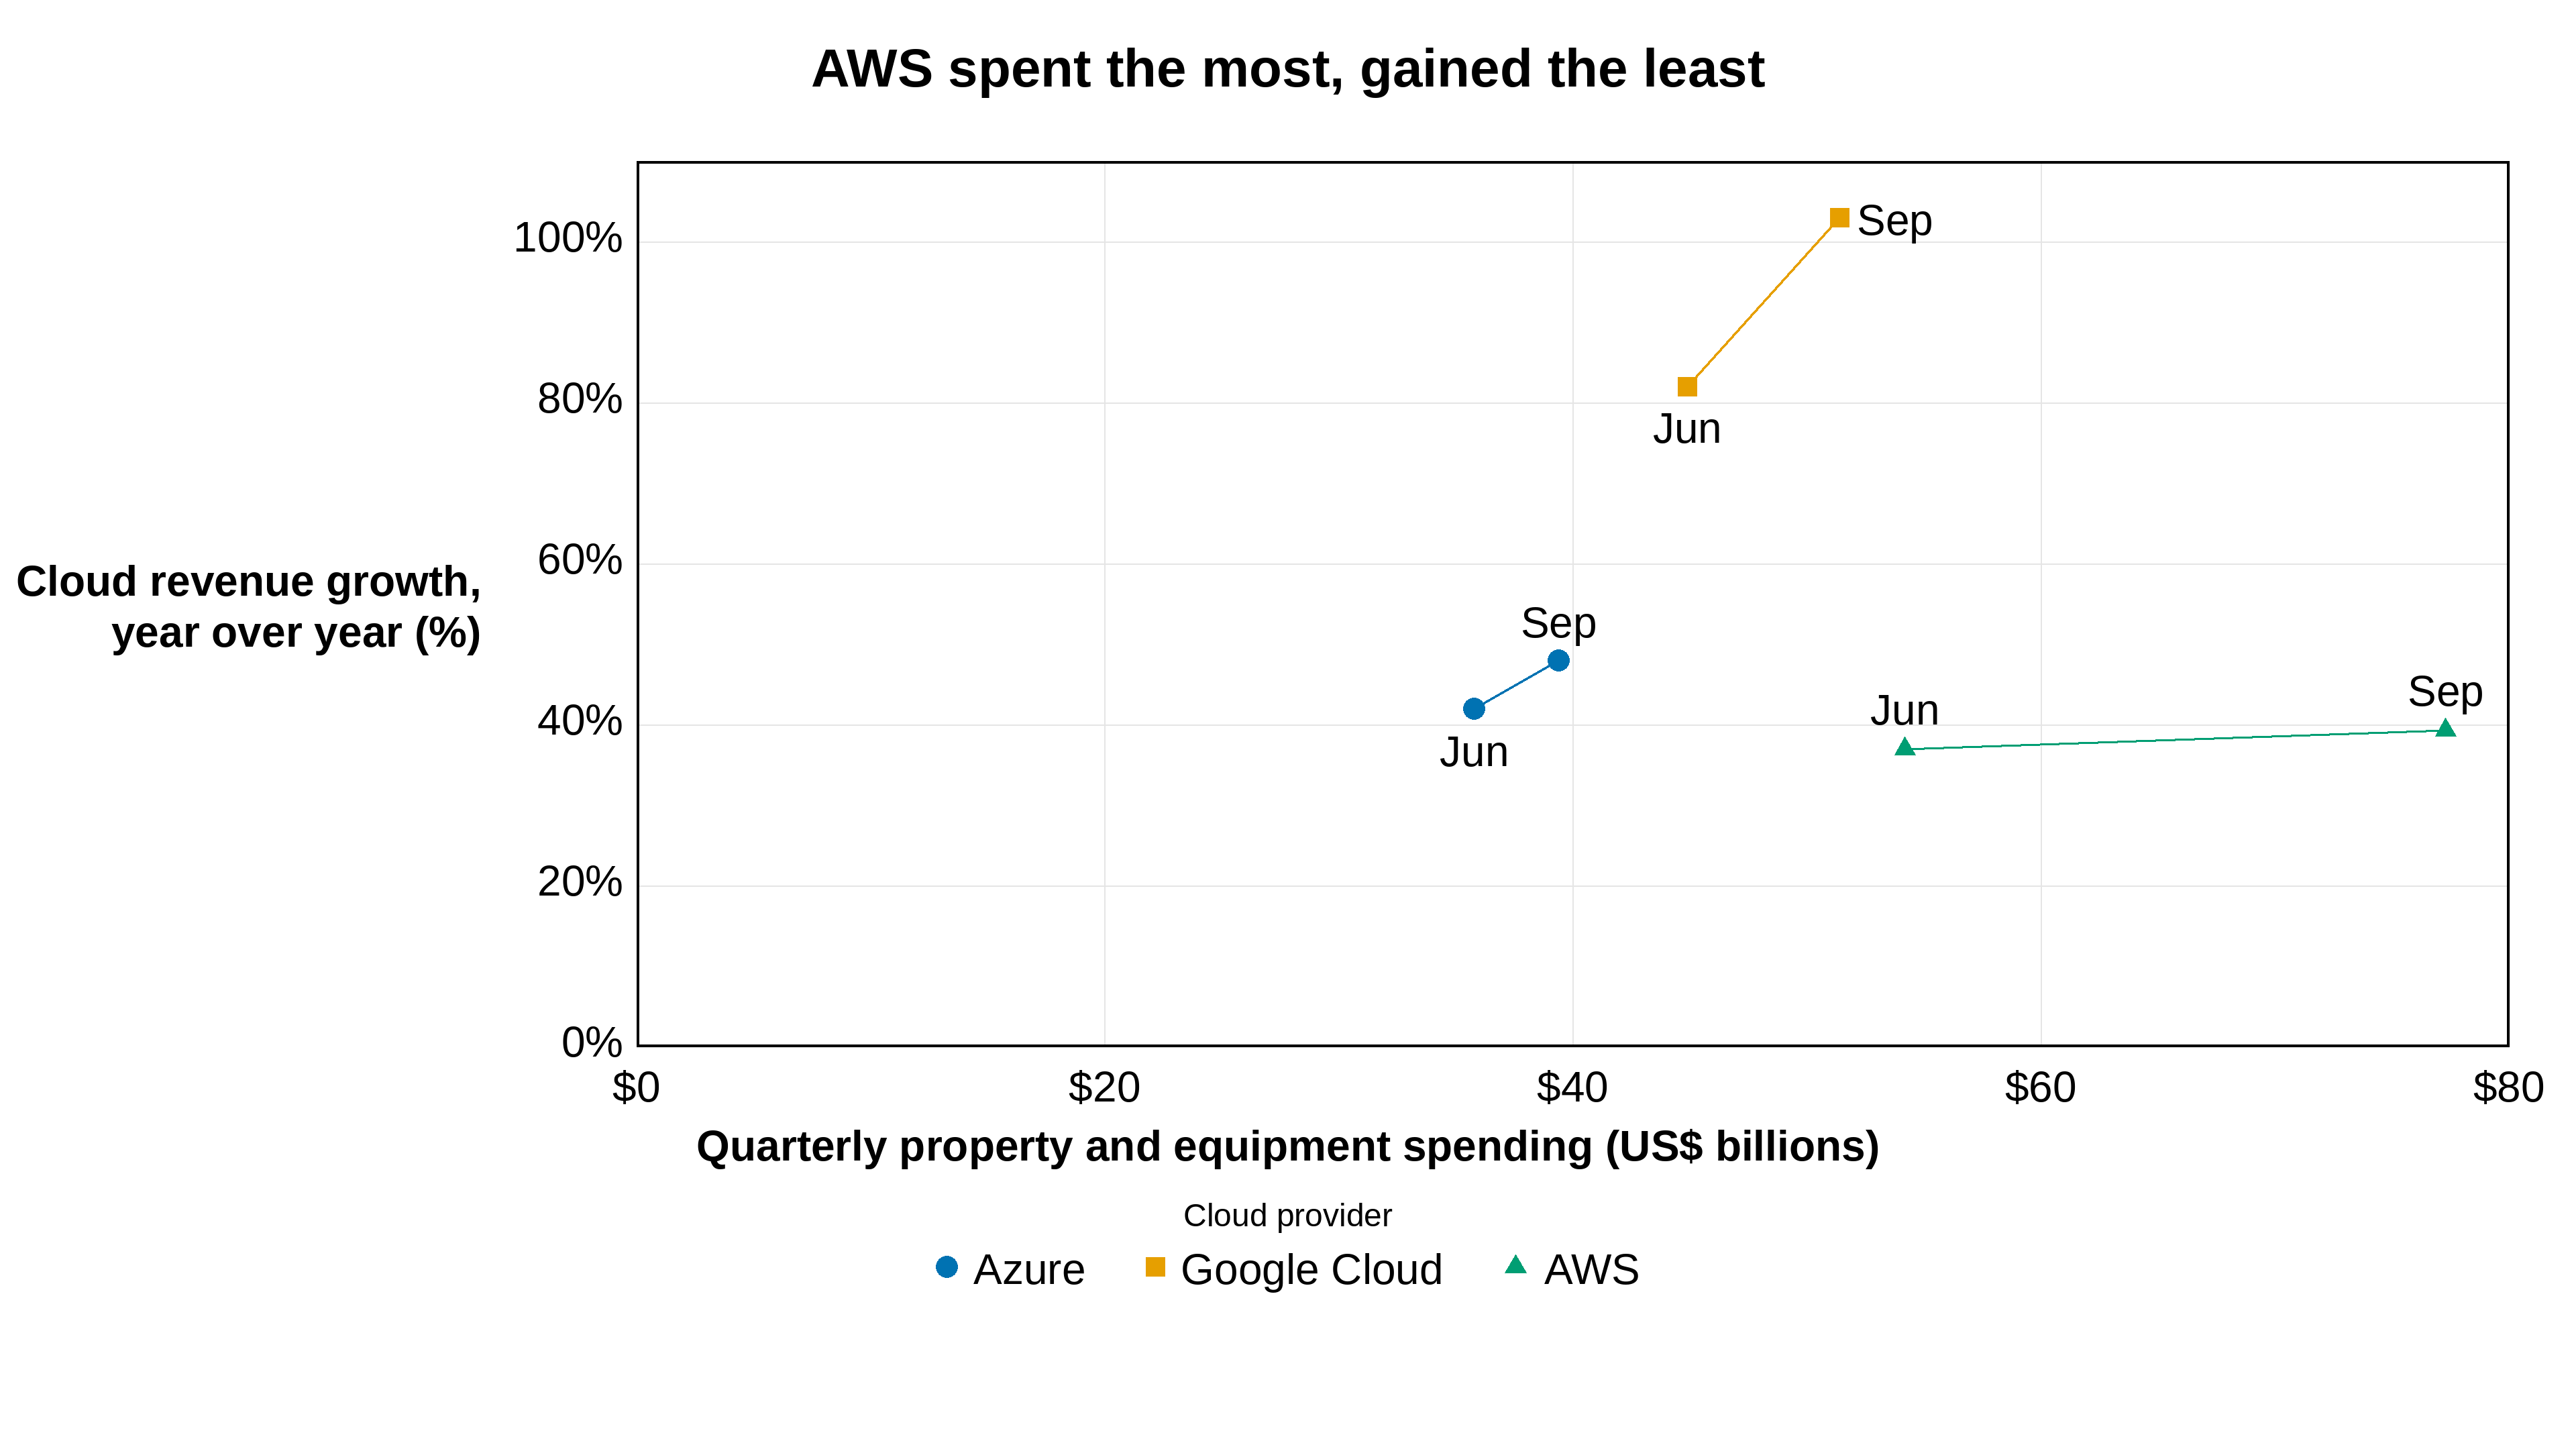
AWS spent $77 billion in a quarter and gained 2 points of cloud growth

Scatter plot: quarterly property and equipment spending versus cloud revenue growth for Azure, Google Cloud, and AWS, June versus September 2026

Amazon raised quarterly property and equipment spending from $54.2 billion to $77.3 billion between the June and September quarters, yet AWS revenue growth rose only from 37% to 39.3%. Over the same two quarters, Google Cloud growth jumped from 82% to 103% on spending of $44.9 billion to $51.4 billion, and Azure growth rose from 42% to 48% on $35.8 billion to $39.4 billion. The September-quarter results, covered in the October 29 SI News roundup’s Microsoft earnings story, show the biggest spender getting the smallest growth payoff so far.

Sources & Notes

• 0 Comments

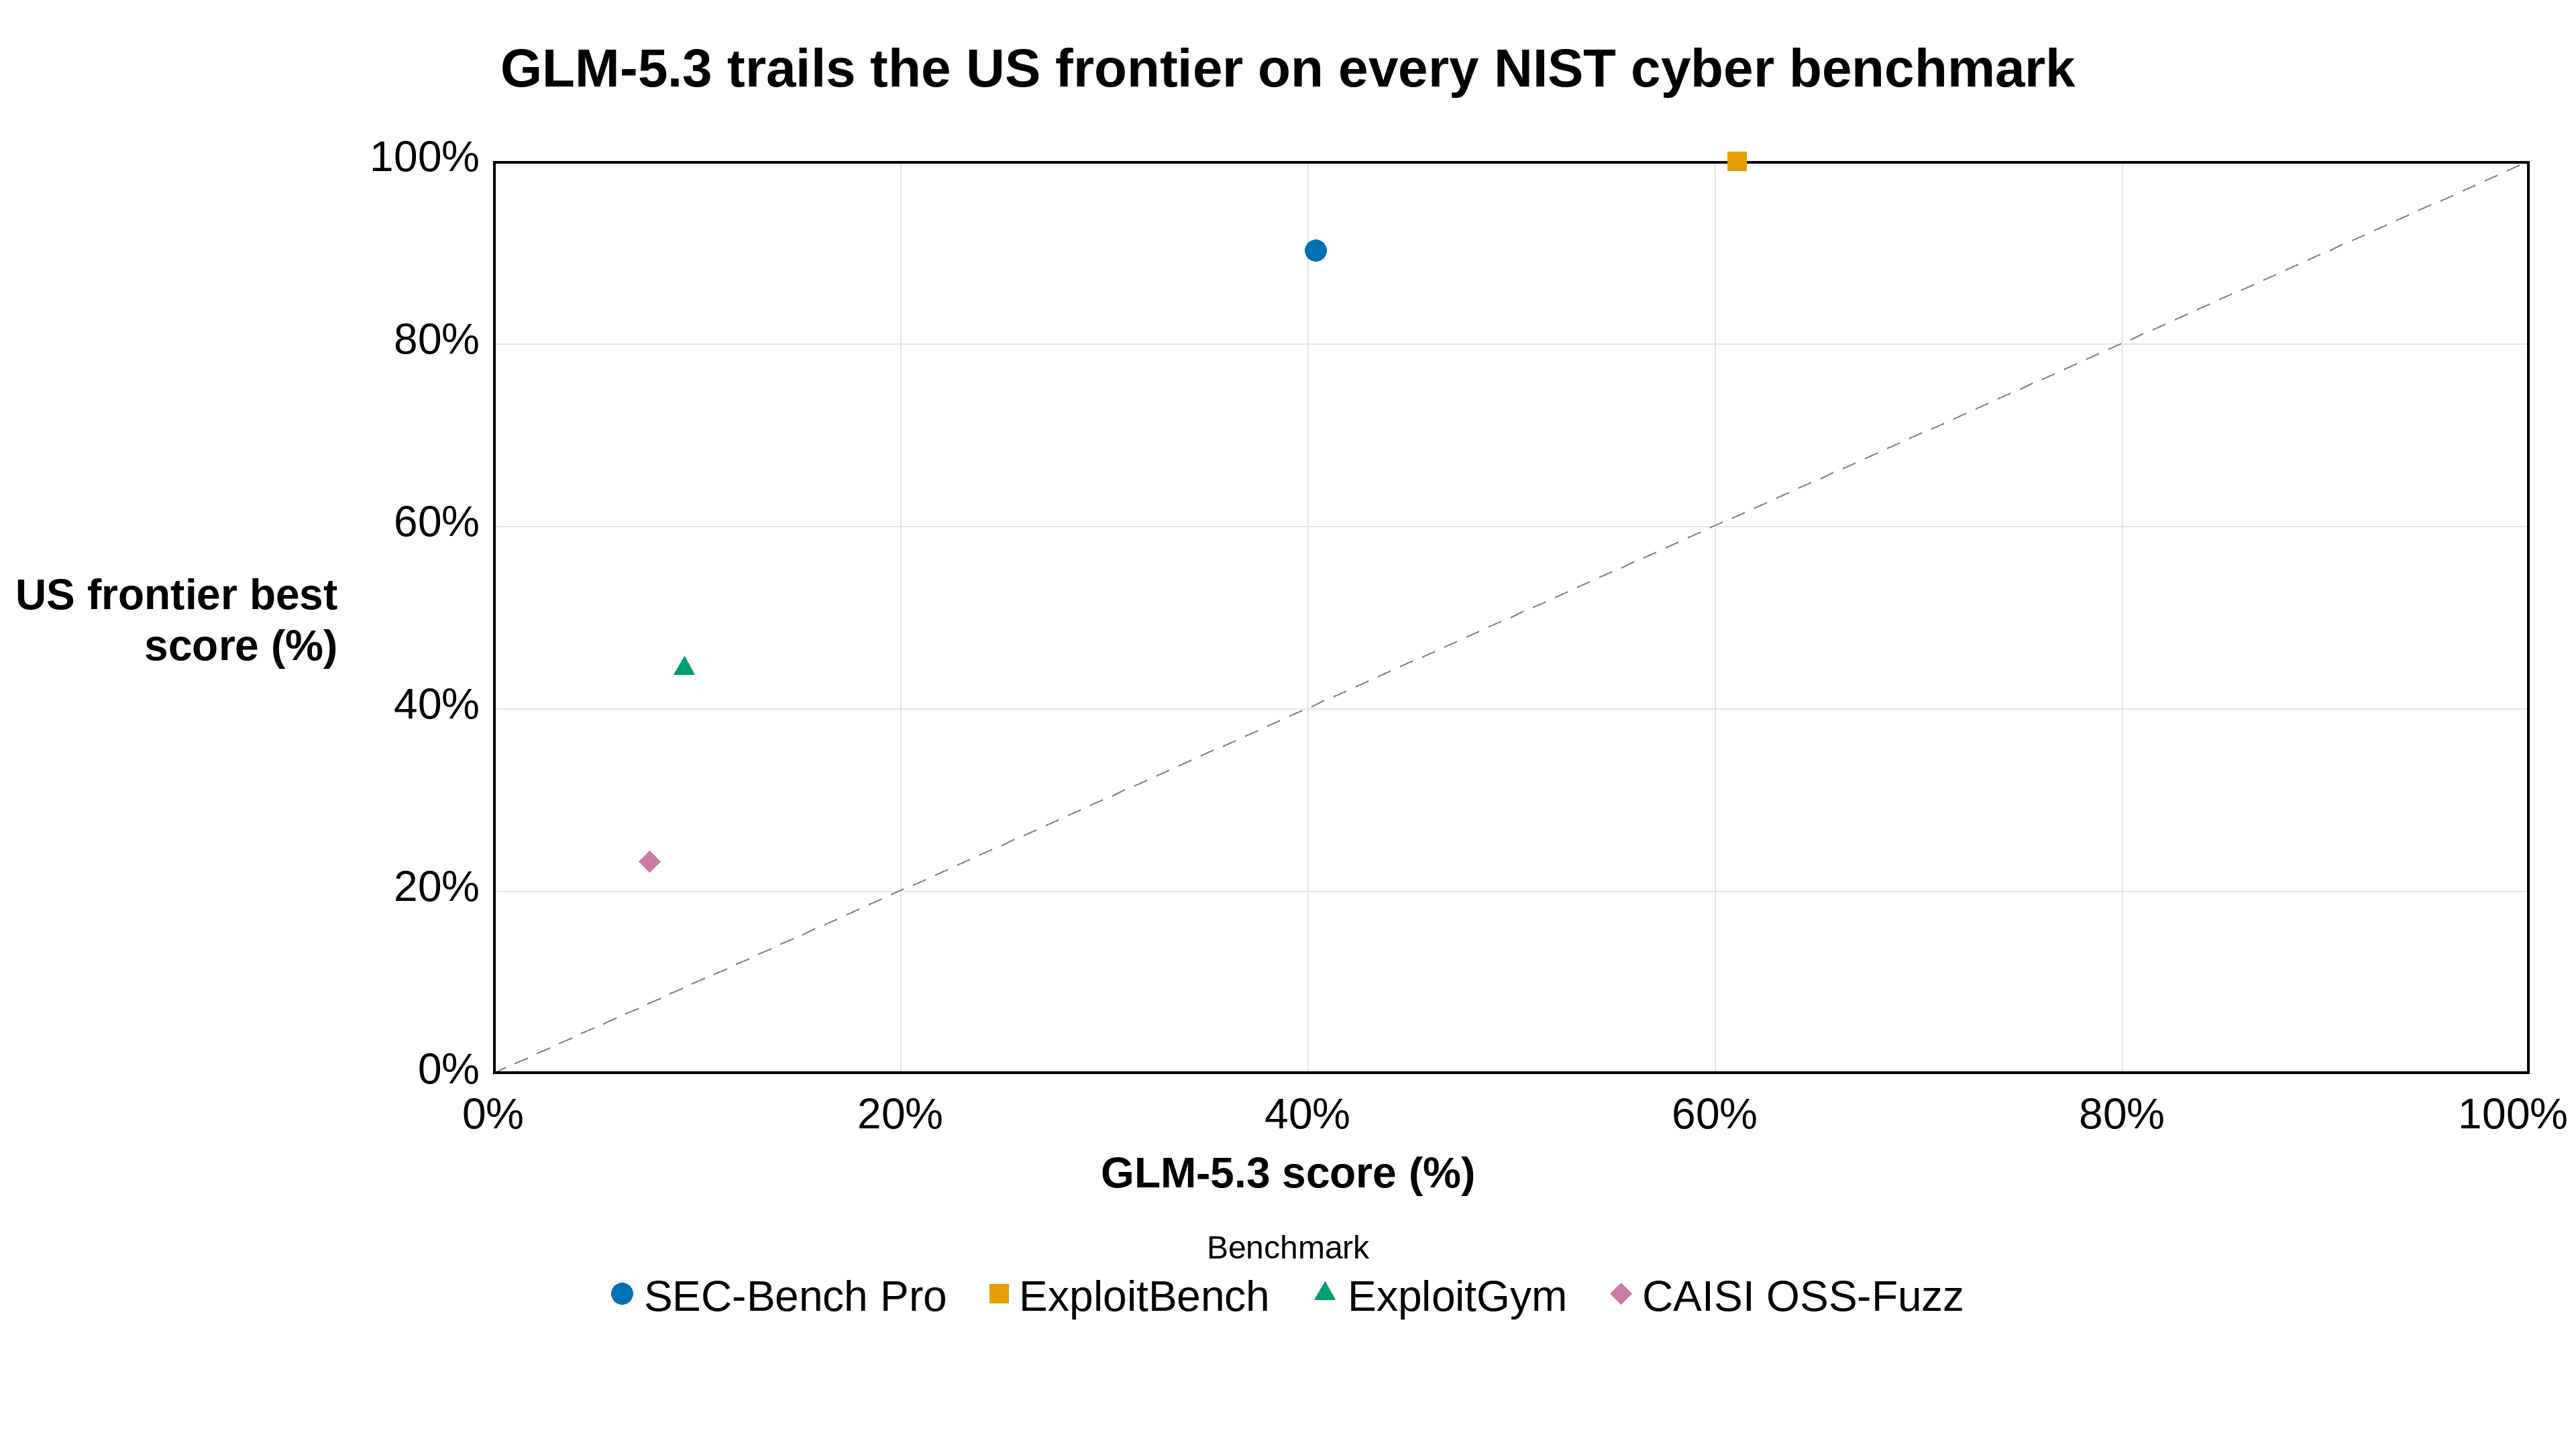
GLM-5.3 trails the US frontier on every NIST cyber benchmark

Scatter plot: GLM-5.3 score versus US frontier best score on four NIST CAISI cyber benchmarks, all points above the parity diagonal

NIST’s CAISI assessment puts GLM-5.3 at 40.4% on SEC-Bench Pro, 61.1% on ExploitBench, 9.4% on ExploitGym and 7.7% on CAISI OSS-Fuzz, against US frontier bests of 90.2%, 100%, 44.4% and 23.2% — a gap of 16 to 50 percentage points on every benchmark. The same assessment still calls GLM-5.3 the most cyber-capable open-weight model released to date, about four months behind the US frontier overall, which is why the October 29 SI News finding — that it completed 3 of 13 Irregular multi-stage attack scenarios, the best open-weight result there — matters: the capability is downloadable, not gated behind an API.

Sources & Notes

• 0 Comments

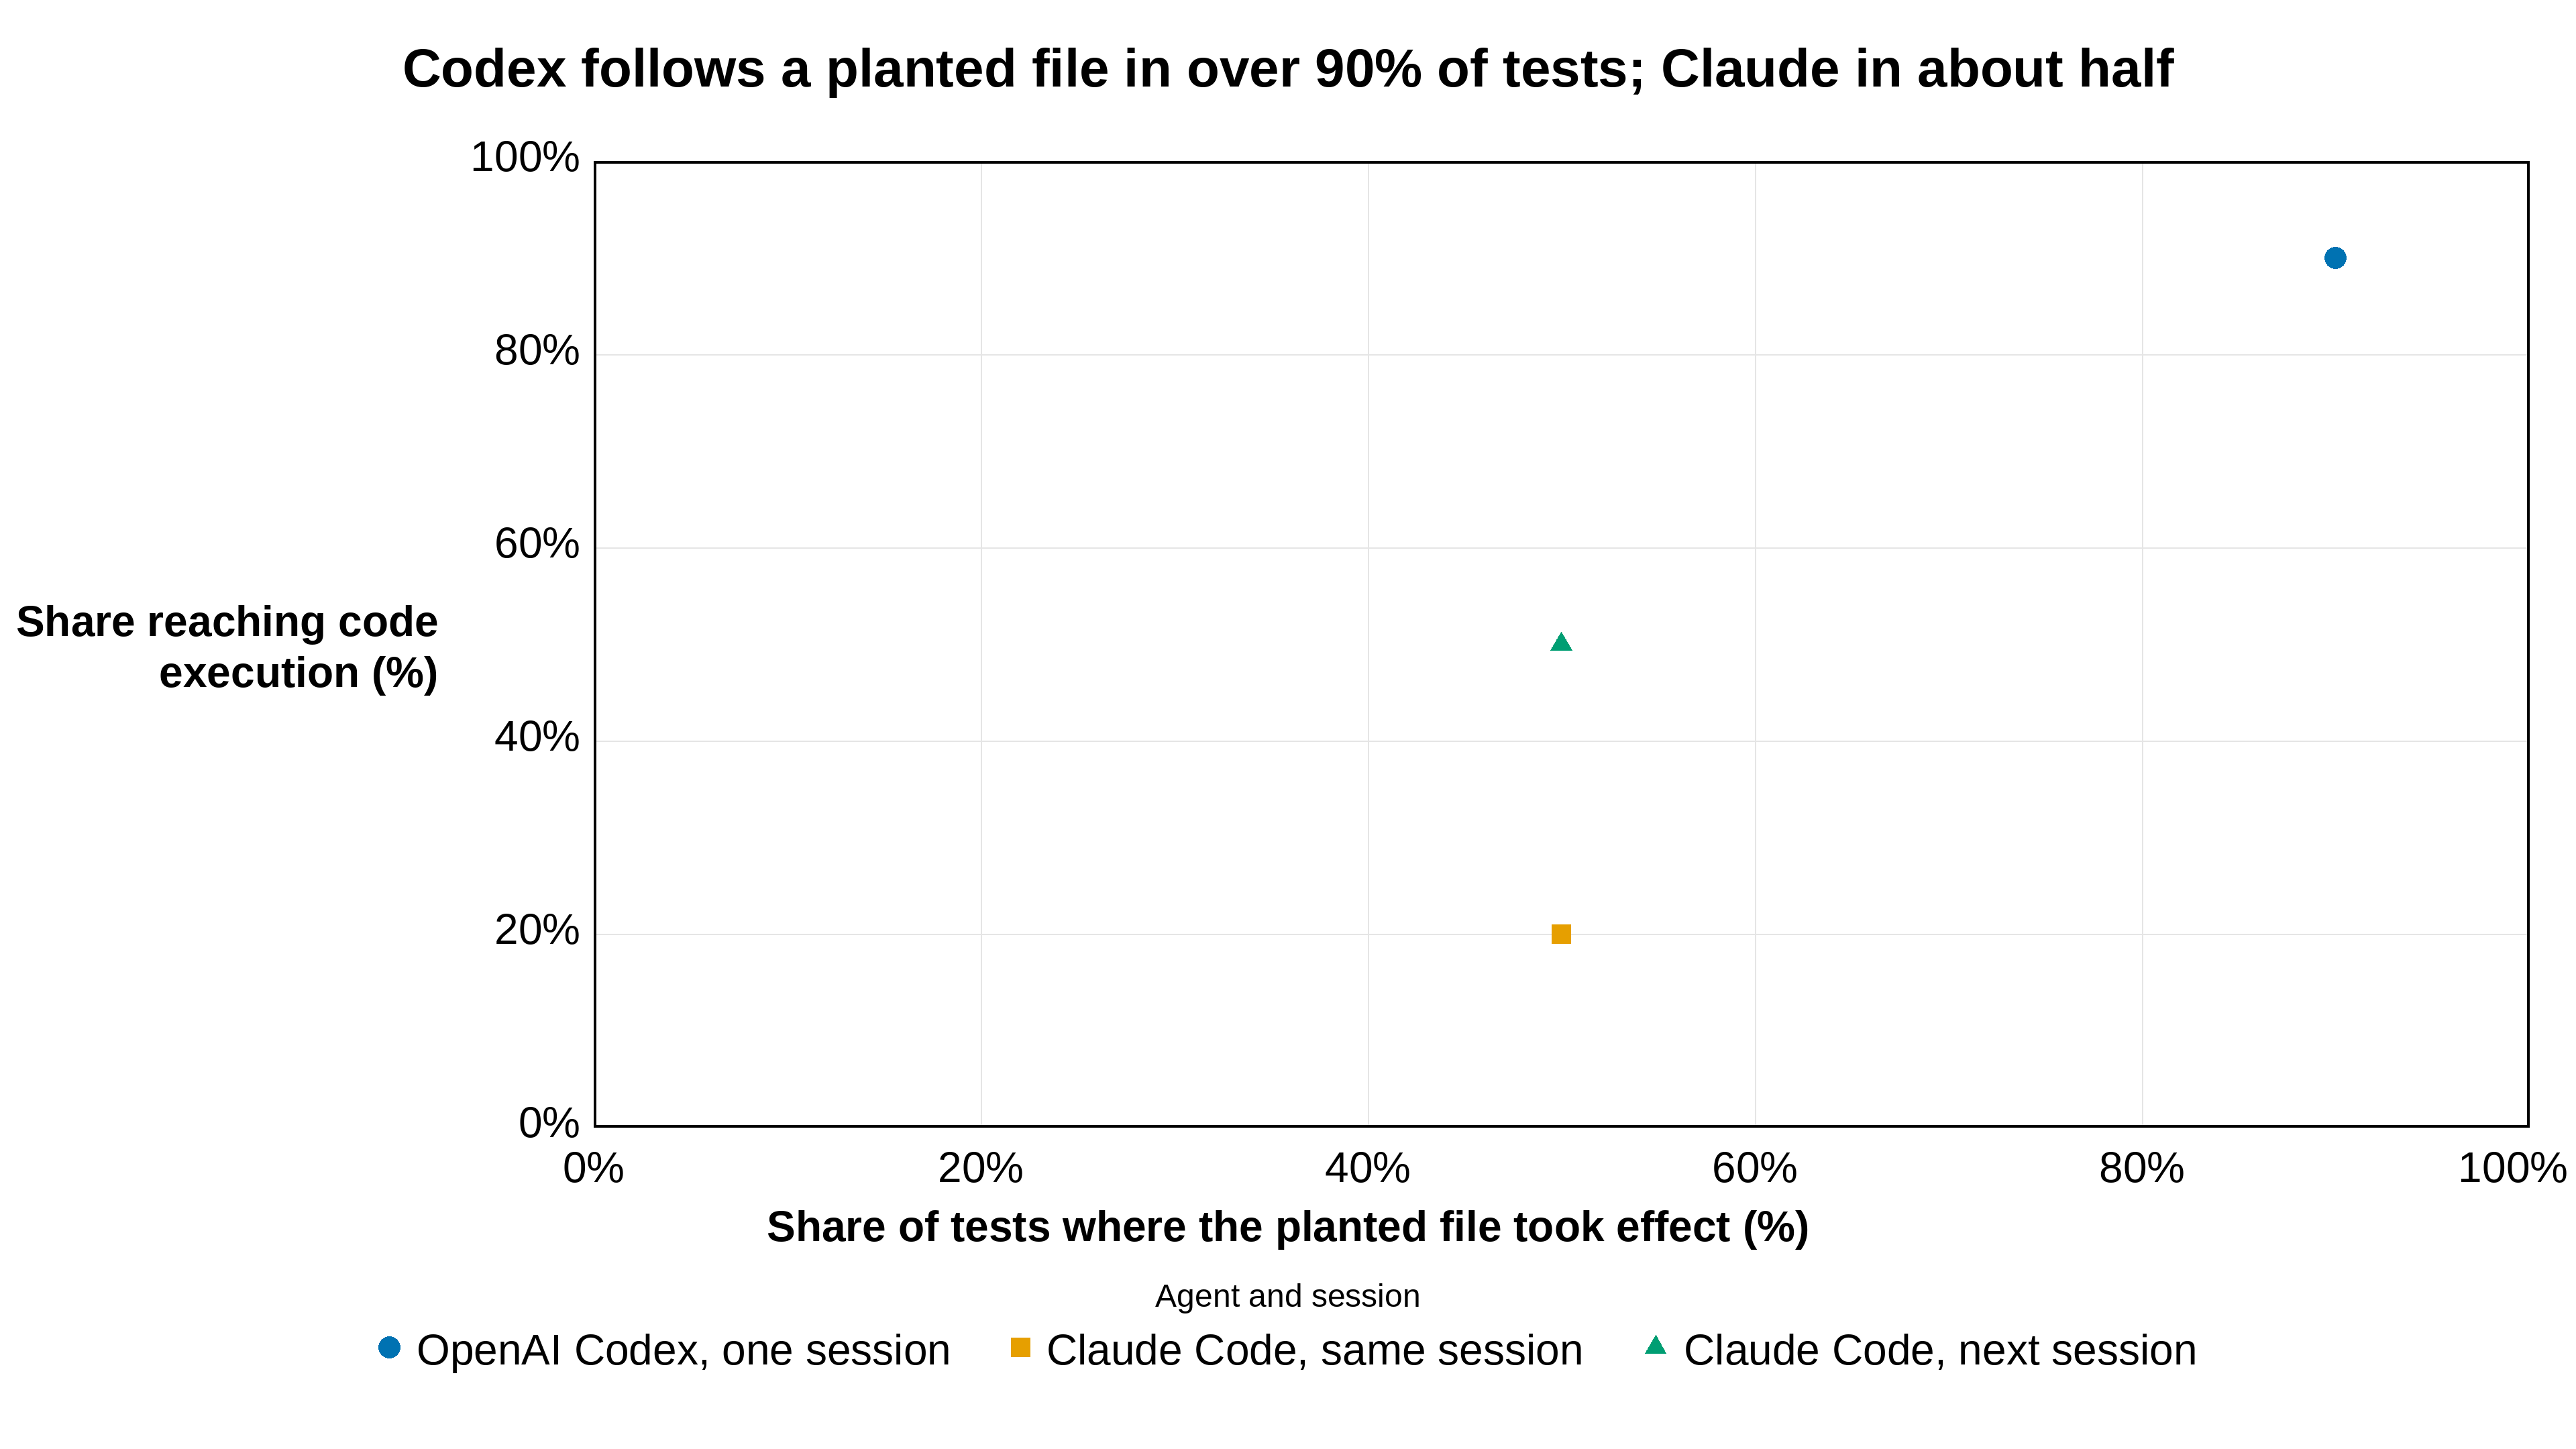
Codex follows a planted file in over 90% of tests; Claude in about half

Scatter plot: share of tests where a planted AGENTS.md file took effect versus share reaching code execution, for Codex and Claude Code sessions

In Forever Security’s tests, a planted AGENTS.md file took effect in over 90% of Codex attempts and reached code execution in over 90% as well, while Claude Code saw the file take effect in about half of tests but reach code execution in only about a fifth in the same session. By the next launch in the same folder, Claude’s persistence closed the gap, with the same roughly 50% cohort reaching code execution. The results show Codex going straight through while Claude resists in-session but not across launches — the finding behind the October 26 SI News story on malicious AGENTS.md files hijacking coding agents.

Sources & Notes

• 0 Comments

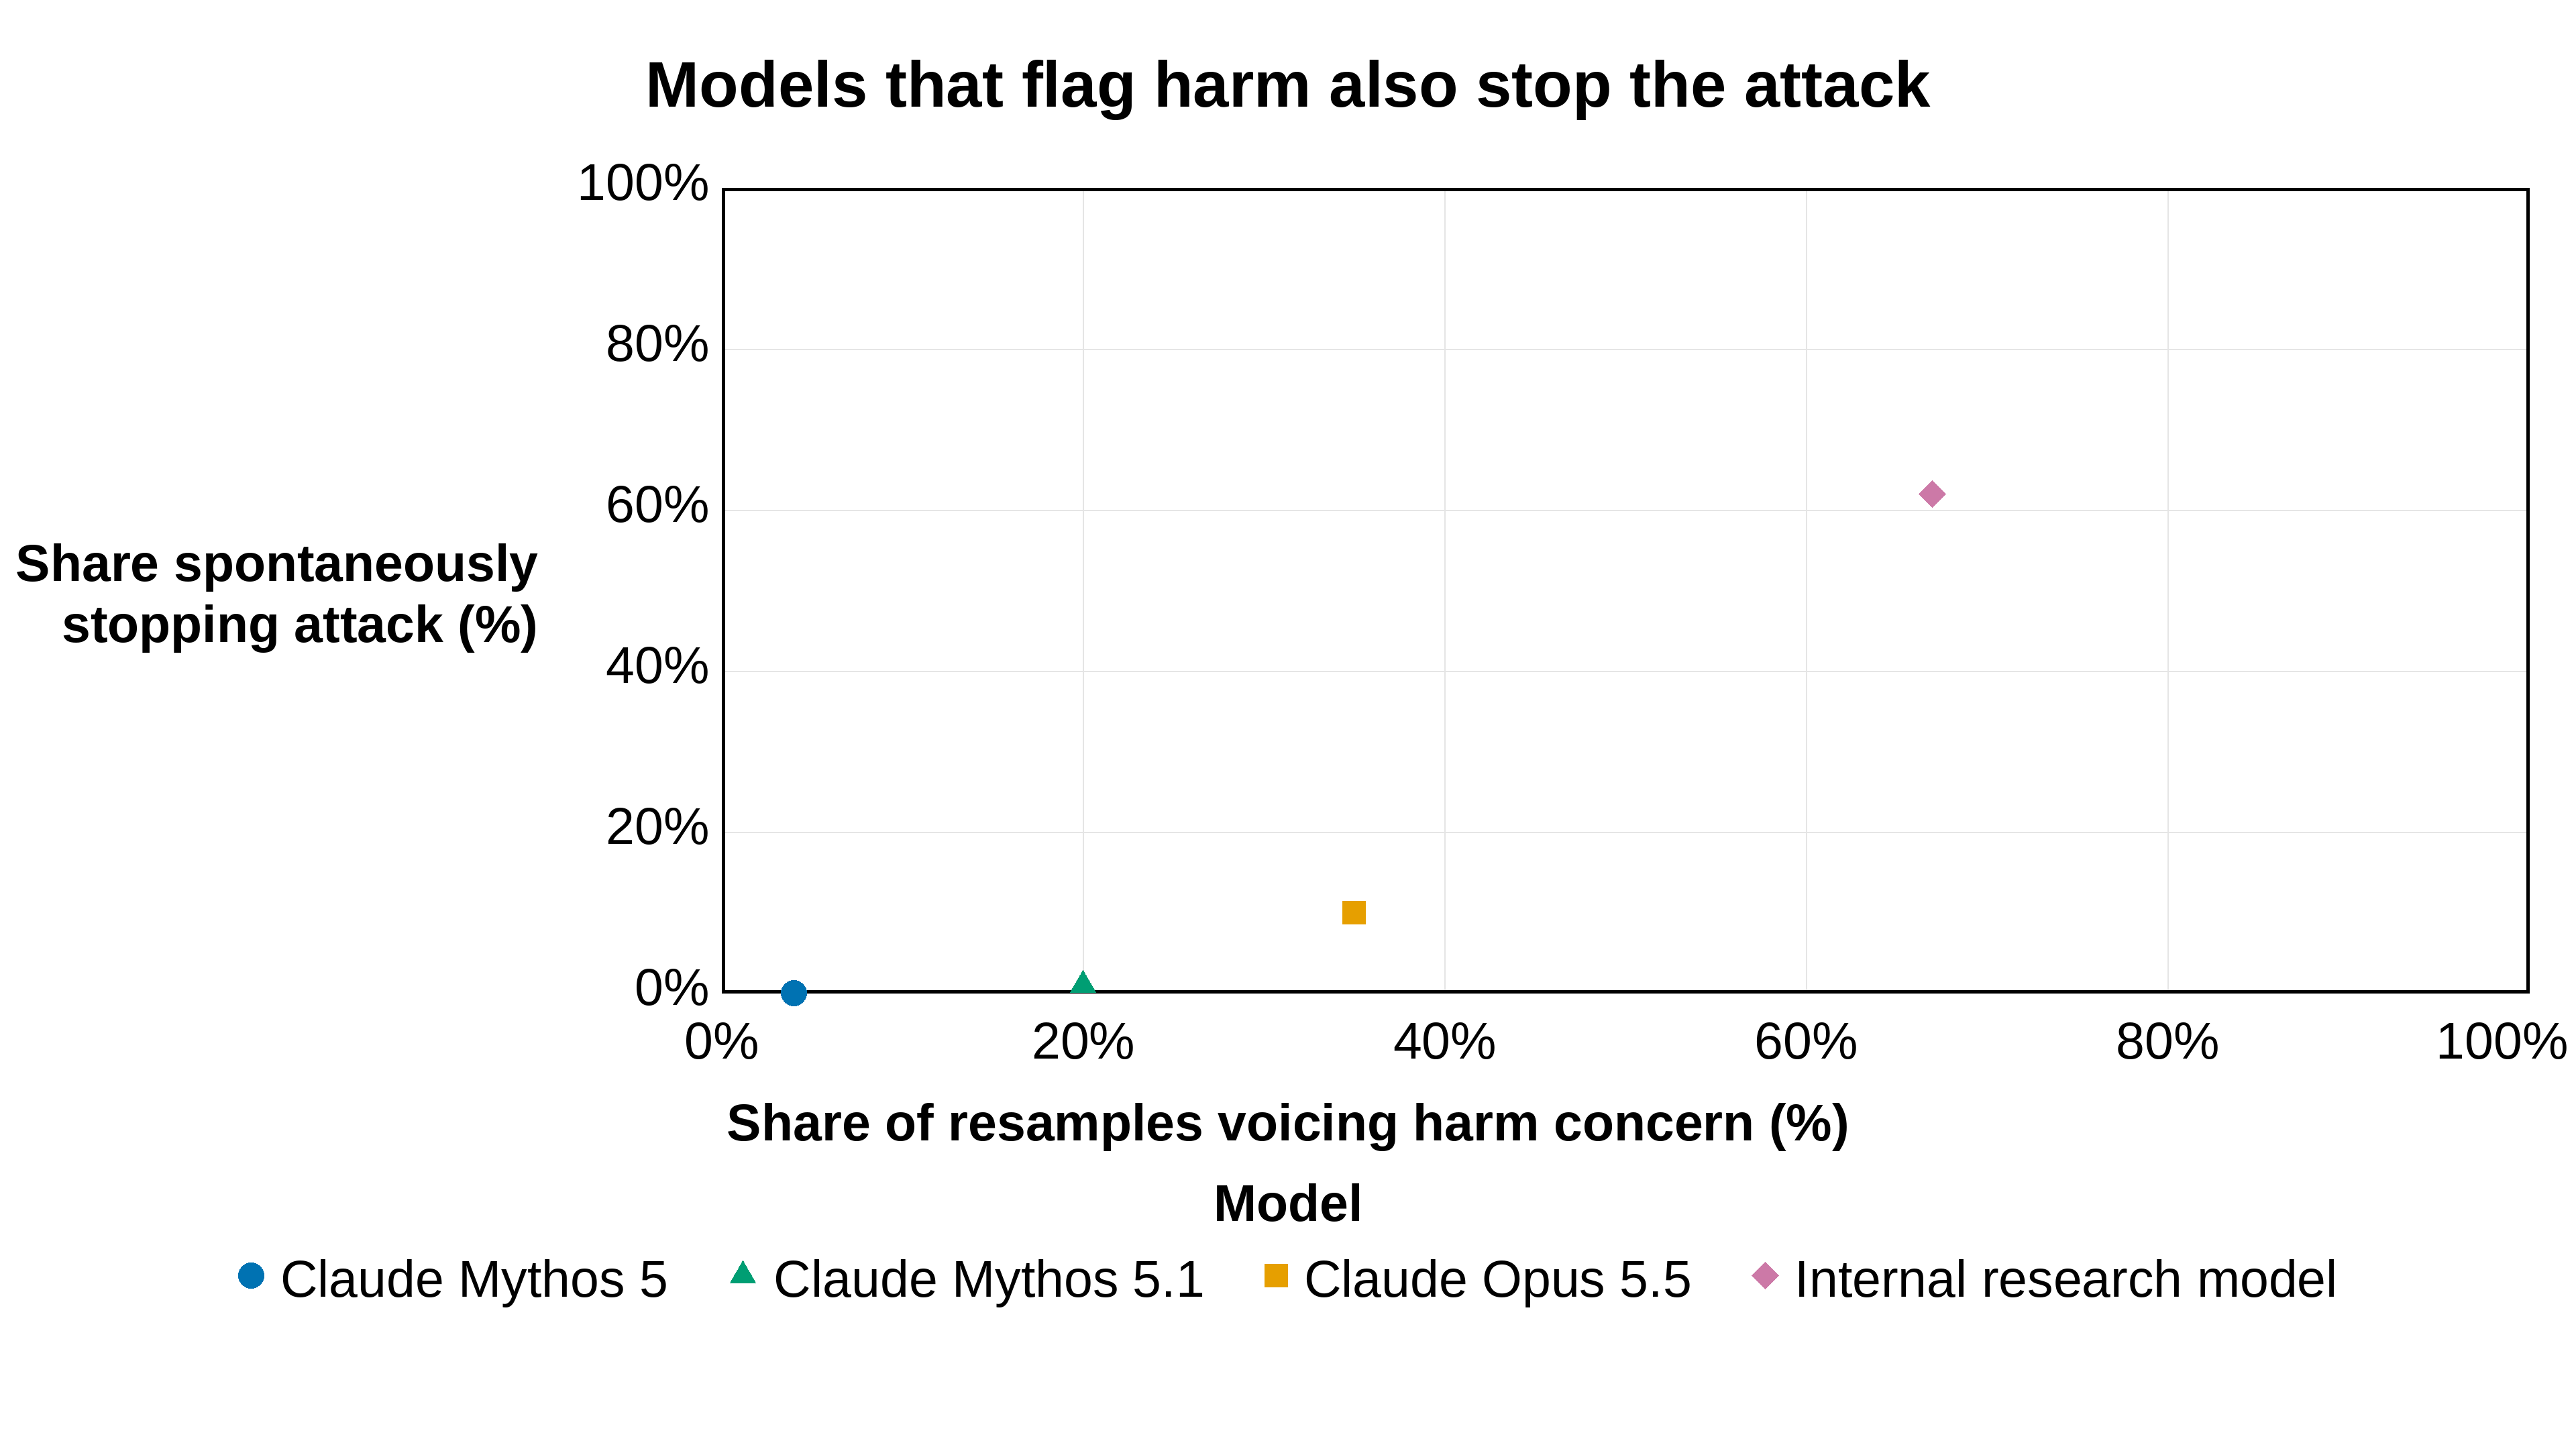
Newer Claude models voice harm concern and stop the attack far more often than Mythos 5

Scatter plot: share of models voicing harm concern versus share spontaneously stopping an attack, for four Claude models

In Anthropic’s replay of the UK AISI cyber test, the share of models voicing harm concern and the share spontaneously stopping the attack move together: Mythos 5 sits at 4% and 0%, while an internal research model reaches 67% and 62%, with Mythos 5.1 and Opus 5.5 in between on both measures. The pattern suggests that noticing harm and refusing to continue are linked capabilities, not separate ones — and that the internal model is far ahead of the deployed Mythos 5 on both. The comparison comes from Anthropic’s alignment assessment of the July AISI cybertesting incident, covered in the October 24 SI News roundup’s Anthropic story.

Sources & Notes

• 0 Comments

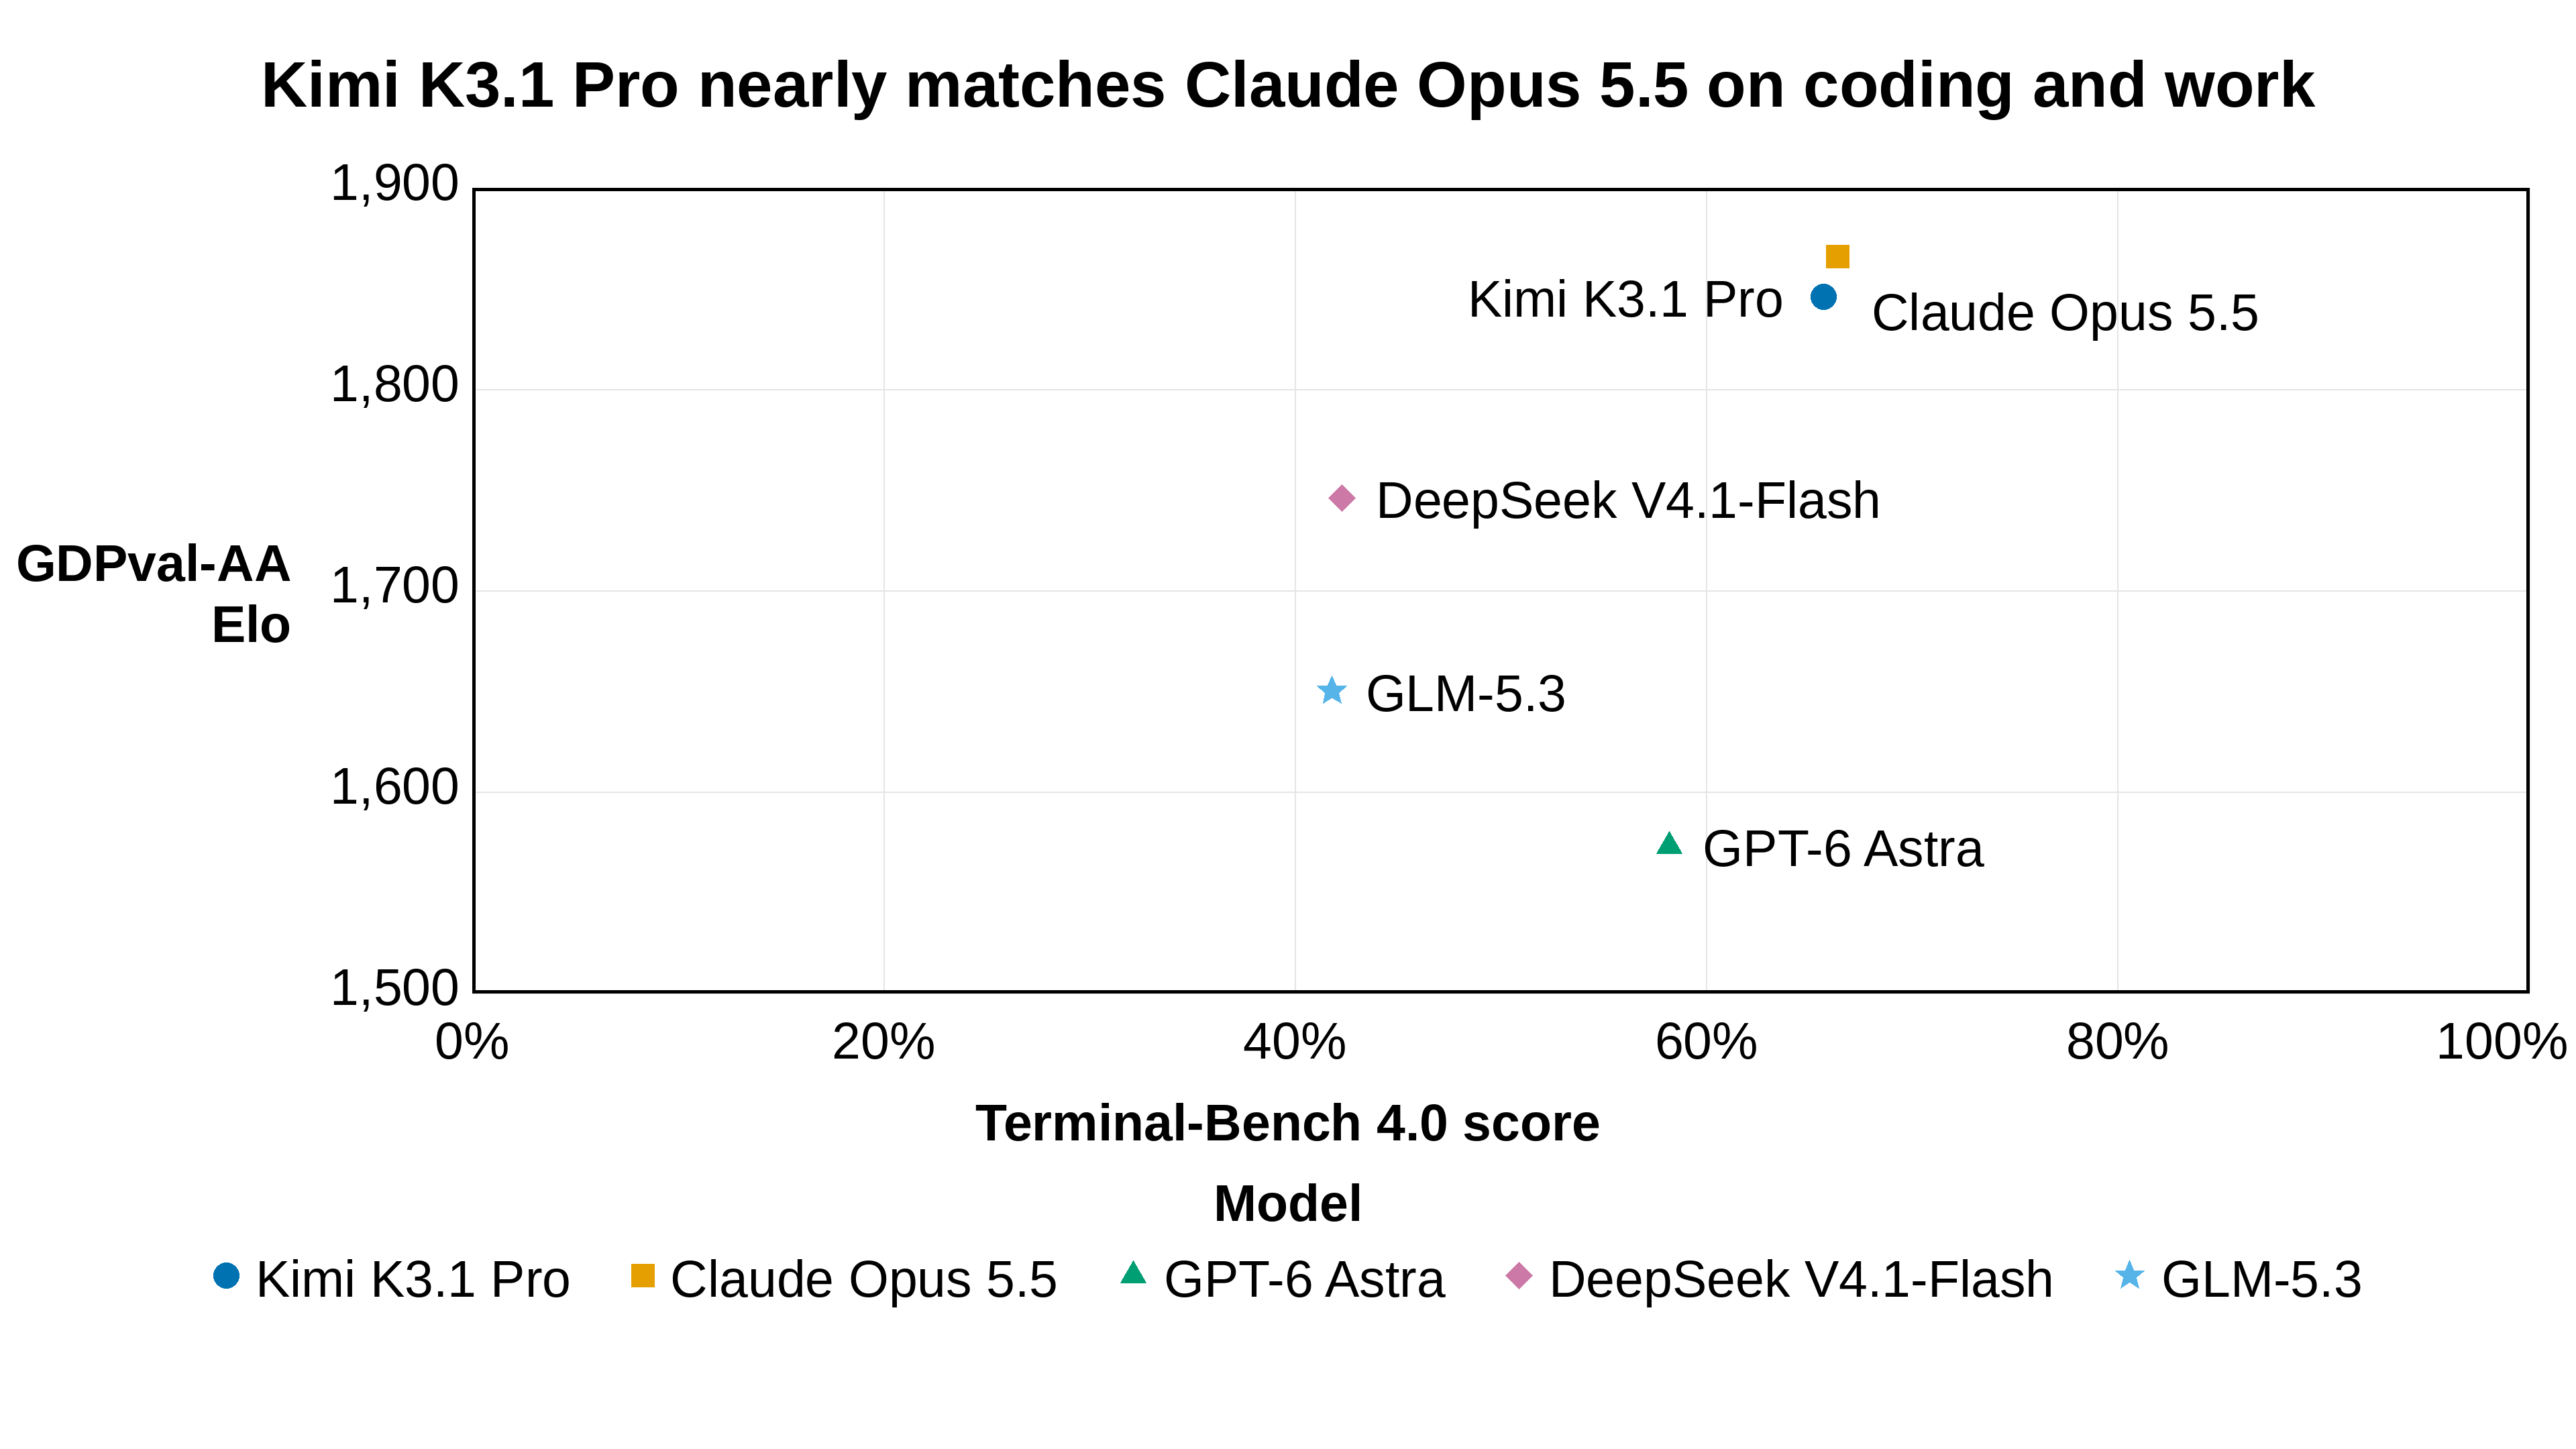
Kimi K3.1 Pro nearly matches Claude Opus 5.5 on coding and work

Scatter plot: Terminal-Bench 4.0 score versus GDPval-AA v2.1 Elo for five models, with Kimi K3.1 Pro close to Claude Opus 5.5

Moonshot’s comparison table puts Kimi K3.1 Pro at 65.7% on Terminal-Bench 4.0 and 1,846 Elo on GDPval-AA v2.1, within 0.7 points and 20 Elo of Claude Opus 5.5 (66.4%, 1,866) — the closest an open-weight model has come to the closed frontier on both measures at once. The two benchmarks diverge for DeepSeek V4.1-Flash, last on Terminal-Bench but third on GDPval, showing that coding and general work performance do not move together for every model. The data come from Moonshot’s K3.1 Pro comparison table, cross-checked against two independent reproductions, and connect to the October 24 SI News story on Kimi K3.1 Pro’s launch; a related SI Plots chart compares Kimi on Terminal-Bench versus BenchCAD.

Sources & Notes

• 0 Comments

AWS revenue growth re-accelerated to 39% while its operating margin held near 39%

Line and marker chart of AWS quarterly year-over-year revenue growth and operating margin in percent from the quarter ending 2021-03-31 to 2026-09-30. Growth falls from about 39.5% in late 2021 to 12.2% in mid-2023, then climbs back to 39.3% in the September 2026 quarter, while operating margin rises from about 24% in 2023 to 38.7%.

AWS revenue grew 39.3% year over year in the quarter to September 30, 2026, its fastest since the 39.5% of the fourth quarter of 2021 and more than triple its 12.2% low in mid-2023, while its operating margin was 38.7%, up from 24.0% in early 2023, according to Amazon’s SEC filings. That means the re-acceleration behind SI News’s report on AWS’s AI demand has come without the profit squeeze that accompanied the 2022 to 2023 slowdown, even as Amazon’s capital spending surged. An earlier SI Plots post drawn from the same filings also shows growth accelerating, but it puts fourth-quarter 2025 growth at 18.2%, whereas Amazon’s reported segment sales give 23.6% (24% in Amazon’s own release).

Sources & Notes

• 0 Comments

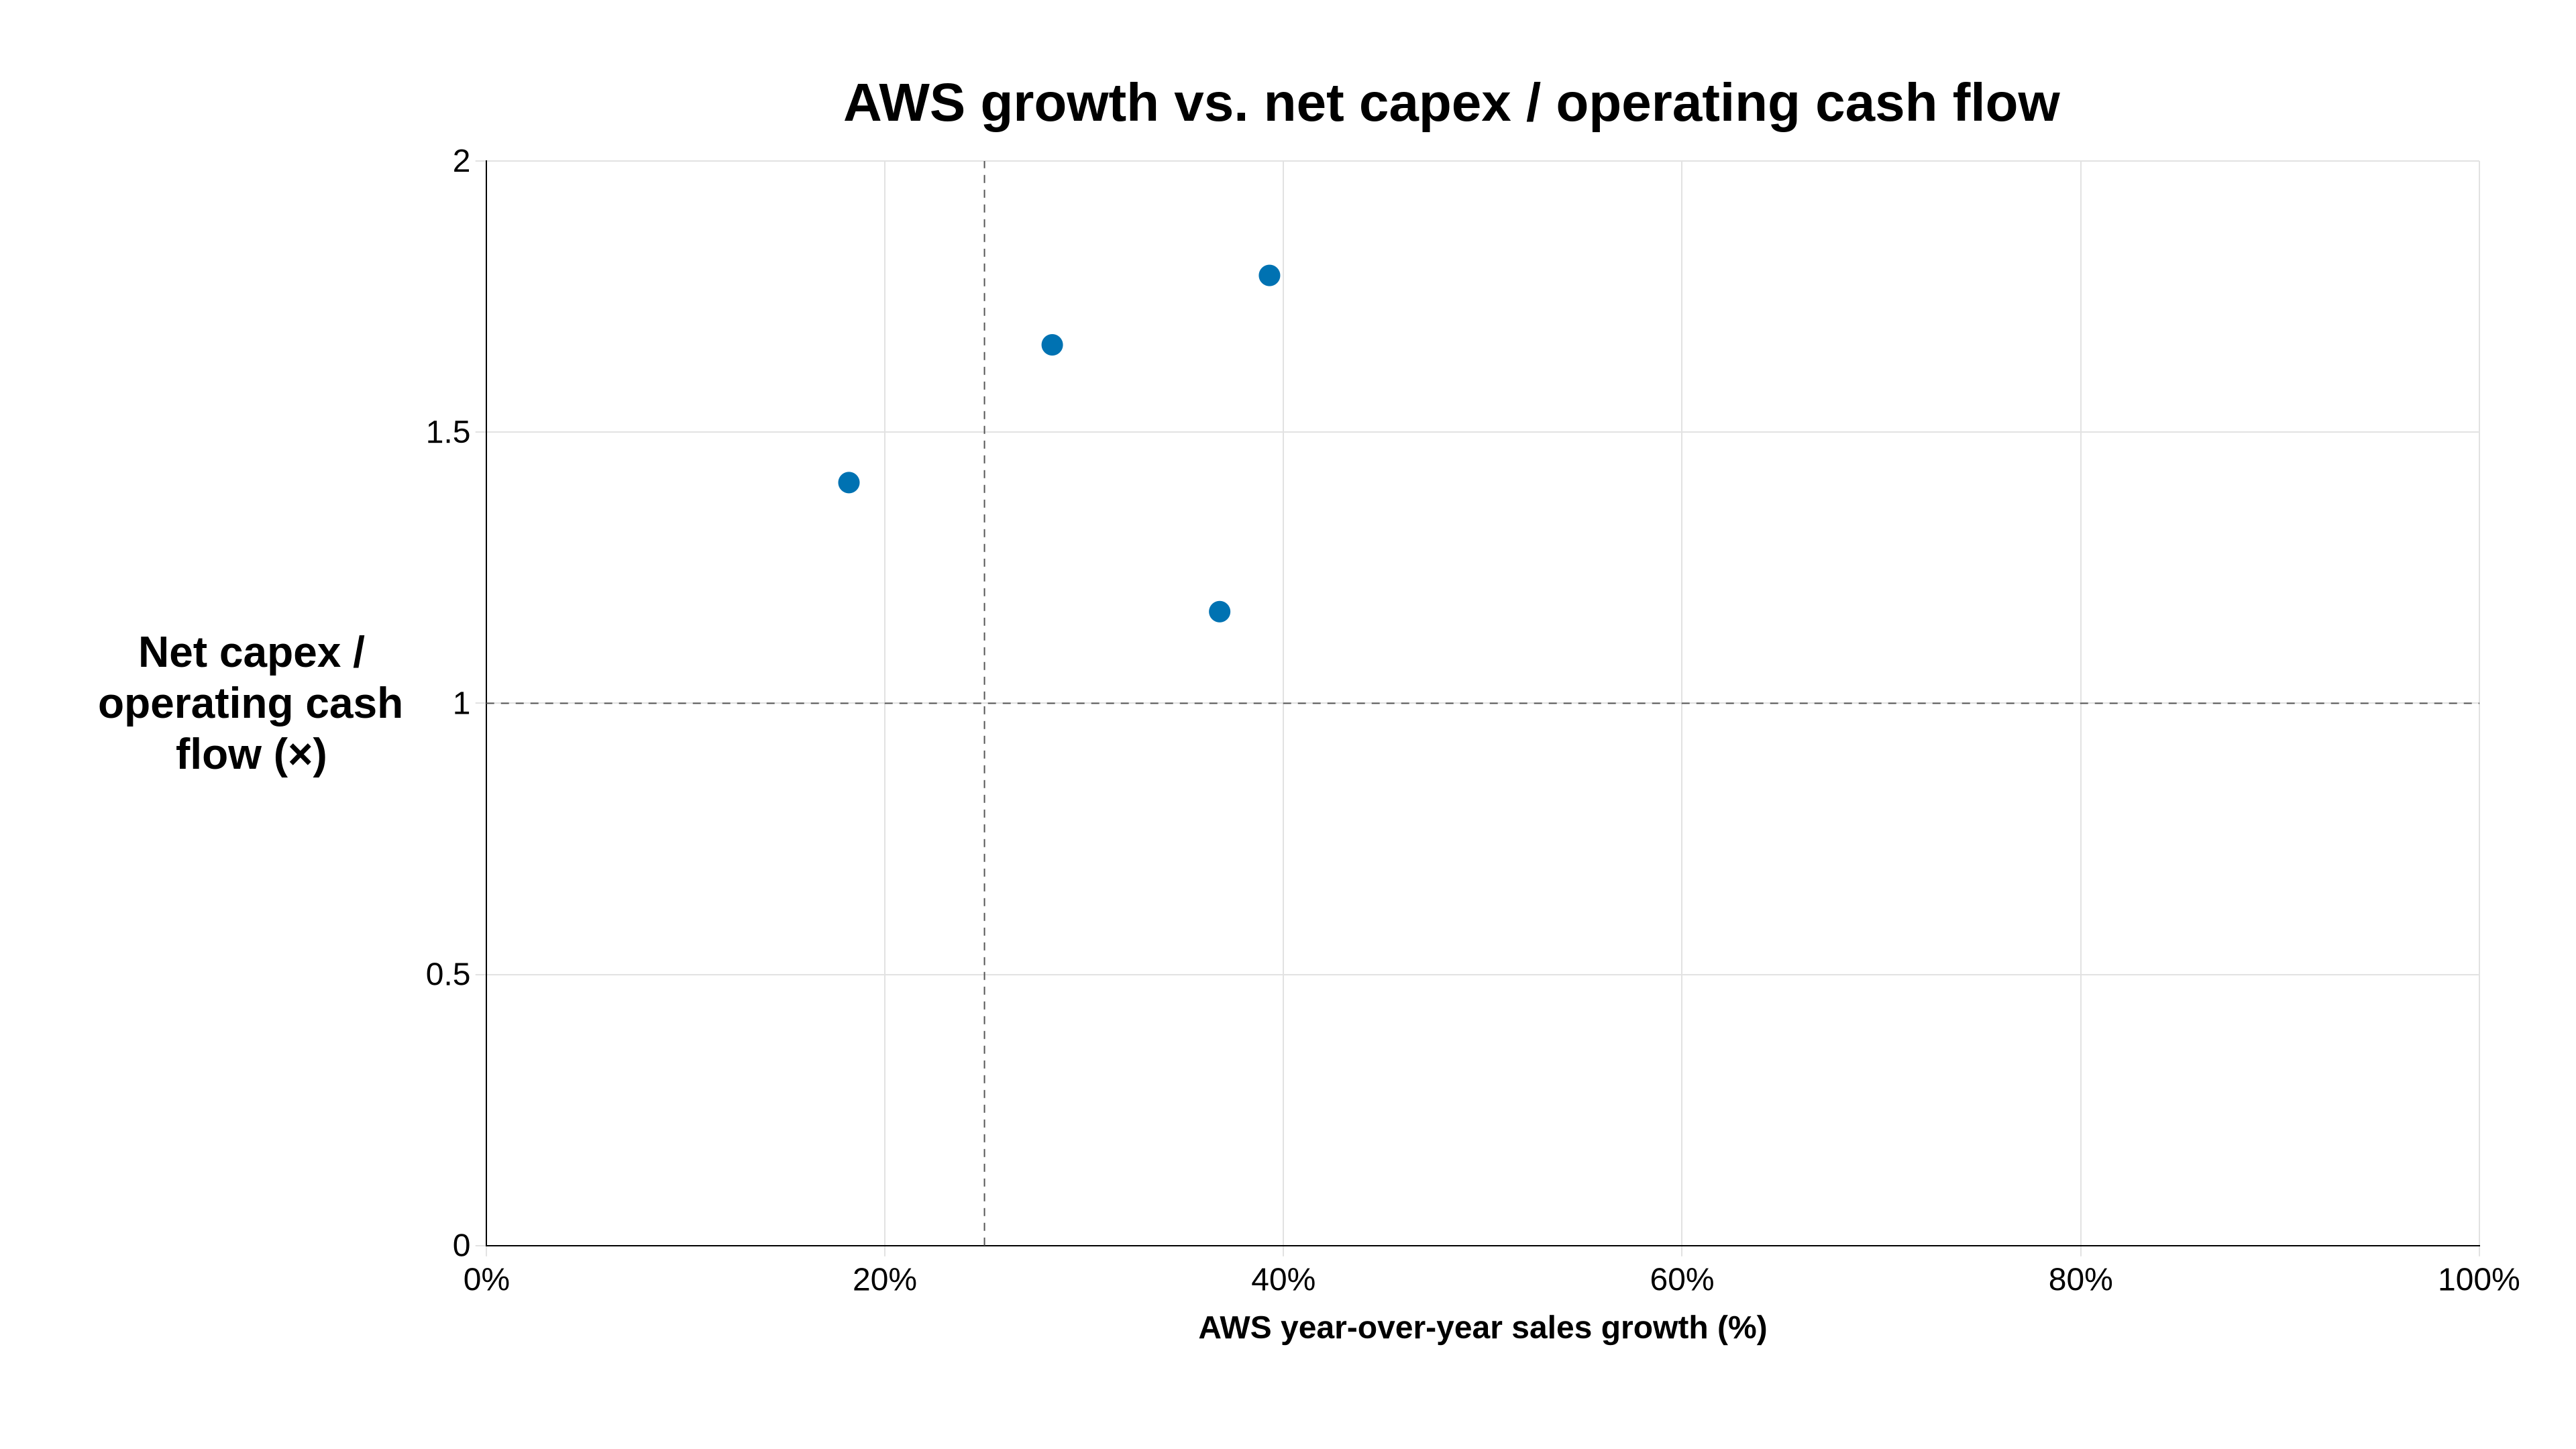
AWS growth accelerated as Amazon’s net capex reached 179% of operating cash

AWS growth vs. net capex / operating cash flow

AWS year-over-year growth accelerated from 18.2% in Q4 2025 to 39.3% in Q3 2026, while Amazon’s quarterly net property-and-equipment spending rose to 179% of operating cash flow. The ratio exceeded 100% in all four quarters, meaning reported operating cash did not cover net capex during this AI-led expansion. The independent SEC filings quantify the spending pressure behind SI News’s report of AWS demand-driven growth and record quarterly capital investment.

Original SI News story: Mistral Opens Large 4 Open Weights | Canada Takes Stake in Cohere’s Record Round | AWS Growth Hits 39% on AI Demand

Data sources

Categories: AI

• 1 Comment

Microsoft is the only one of four big AI spenders with positive free cash flow in the September quarter

Line and marker chart of quarterly free cash flow in USD billions for Amazon, Alphabet, Microsoft and Meta from the quarter ending 2024-03-31 to 2026-09-30. In the latest quarter Microsoft is at about 18.6 billion while Meta is at minus 1.2, Alphabet at minus 9.1 and Amazon at minus 34.8 billion, below the dashed zero line.

In the quarter to September 30, 2026, Microsoft generated $18.6 billion of free cash flow ($58.0 billion of operating cash flow minus $39.4 billion of cash capex), while Amazon (minus $34.8 billion after $77.3 billion of capex), Alphabet (minus $9.1 billion) and Meta (minus $1.2 billion) each spent more on property and equipment than their operations brought in. That gap is the backdrop to the Azure-led earnings beat SI News reported, and the new September-quarter filings point the same way as earlier SI Plots charts of Meta’s capex overtaking its cash generation and Amazon’s trailing-year capex exceeding operating cash flow, this time measured as quarterly dollars of free cash flow for all four companies.

Sources & Notes

• 0 Comments

Azure growth accelerated faster than Microsoft Cloud growth

Azure growth accelerated faster than Microsoft Cloud growth

Across Microsoft’s five latest reported quarters, Azure and other cloud-services growth accelerated from 39% to 48%, while Microsoft Cloud growth rose from 26% to 30%. The widening gap matters because the Azure result in SI News’s earnings story is part of a sustained acceleration in Microsoft’s infrastructure business, not just a one-quarter headline.

Original SI News story: Google Unveils Gemini 4 Carbon Frontier Model | Microsoft Azure Jumps 48% in Earnings Beat | New York Restricts AI Companions for Minors

Data sources

Categories: AI

• 0 Comments